Scrubbing right in the path, no rerouting
The DDoS processor sits permanently between our backbone and your network. An attack is dropped the moment it arrives: there is no waiting for detection, rerouting or human intervention.
Always in the path
Your CPE has its own eBGP session with the DDoS processor in a dedicated VLAN and receives a default route from it. The backbone sends traffic for your prefixes preferably via the DDoS processor. Both directions pass through the protection.
Never a black hole
Every 500 ms, a health watchdog checks that the data plane is coping with the traffic. If it is not, it shuts down BGP and traffic goes directly via PE. In the lab, traffic switched to the backup path within 1 s and switching back caused no loss.
< 1 s to switch to the backup path if the data plane fails 0.78–0.97 s, lab
Independent and fast
A rule change reaches the DDoS processor in tenths of a second. If the control server goes down, the DDoS processor keeps scrubbing according to the latest rules: in the lab, 30 minutes without the control server and not a single packet lost.
0.1 s for a rule change to take effect on the DDoS processor median 0.096 s, lab
From amplification to DNS attacks
Every attack type is in our regression suite in both IPv4 and IPv6 variants. Data plane results are compared with a reference model packet by packet (410 out of 410 cases match).
| Attack | What it looks like | How we stop it |
|---|---|---|
| Amplification (reflection attack)DNS, NTP, memcached, SSDP, CLDAP, SNMP, NetBIOS… | Huge responses from abused servers that you never asked for. | A filter based on the source UDP port. With connection tracking, DNS amplification too, while responses to your own queries still get through. |
| SYN flooda flood of TCP opening packets | Hundreds of thousands to millions of SYNs per second, swamping the server with half-open connections. | SYN proxy with cookies: the connection to the server is set up only after a valid response from the client. Plus a limit on new connections per second (SYN/s) and dropping of SYNs to closed ports. |
| ACK, RST and FIN floodTCP without a connection | TCP packets that do not belong to any connection. | Connection tracking: TCP outside an established connection is dropped, and ongoing connections are not affected. |
| UDP floodrandom ports or a single port | A flood of UDP to ports where no service is running, or at a single service. | Allowed UDP ports, a packets-per-second limit for each port and a bit/s limit. |
| Random subdomain attackDNS water torture | Queries for non-existent names (x7k2q9.your-domain.cz) that overwhelm your DNS server. | For a zone under attack, it drops unknown names that look random. The DDoS processor learns the known names from your server's responses and never limits them. |
| Other DNS attacksdictionary, flood from a single source | Dictionary queries, a single source with thousands of queries, ANY and AXFR, malformed queries. | A per-source query limit, a limit on unknown names per zone, blocked query types, format checks. |
| Connection table exhaustion | The attacker opens connections until there is no room left. | A per-source connection limit, shorter timeouts from 80% full, eviction of half-open connections (never established ones). |
| ICMP flood | A flood of ping and other ICMP. | An ICMP limit. ICMP errors for your connections (e.g. Path MTU) get through. |
| Fragments and malformed packetsping of death, land, Xmas, smurf… | Nonsensical fragments, impossible TCP flag combinations, spoofed sources from non-public ranges. | Packet checks, always on and with no configuration. Plus optional dropping of UDP fragments. |
| Traffic from unwanted sources | A network an attack came from, or a country you do not expect traffic from. | Prefix blocklist and country geoblocking (DB-IP geolocation, updated monthly). |
| Overload beyond the contracted capacity | Anything that exceeds the contracted capacity. | A policer in packets and bits protects your line and other customers. |
| Massive volumetric attacka volume that would swamp the network | An attack so large that it would saturate the links before even reaching the DDoS processor. | A scrubbing centre is automatically brought in upstream and filters out the attack before it reaches our backbone. |
The protection does not decrypt. It reads only the unencrypted parts of the traffic. TLS and HTTP protection is in the works, see the roadmap.
Seven steps, and every packet has its reason
A packet passes through the steps in a fixed order, and the first step that drops it decides. Every packet ends up in exactly one counter, so in the portal you can see how much each rule dropped. The rules you set yourself have two modes: monitor (only counts what it would drop) and enforce.
Always
Packet checks
Malformed headers and lengths, dangerous fragments, impossible TCP flags, land, sources from non-public ranges, broadcast. No configuration needed.
Contracted capacity
A policer in packets and bits per second, as set in your contract. It protects your line and other customers, and applies to allowed sources too.
Monitor / enforce
Protocol policy
Blocklist, allowlist (administrators), country geoblocking, allowed protocols, amplification by source port, allowed UDP and TCP ports, UDP fragments.
Connection tracking and SYN proxy
A bidirectional connection table: TCP outside a connection, UDP to a closed port without a connection, a per-source connection limit. SYN proxy with cookies, optionally only during an attack.
Application layer: DNS
Malformed queries, blocked types, a per-source query limit, random subdomains and dictionary attacks for a zone under attack. Known names are learned from your server's responses.
Limits by traffic type
New connections (SYN) per second, UDP packets per port, UDP bit/s, ICMP and other protocols. The template proposes the numbers based on capacity, or we calculate them from your traffic.
Clean traffic
Delivery to you
Passed traffic goes into your VLAN. Your servers' responses go back the same way, so connection tracking sees both directions.
Every second, you know what is happening
The DDoS processor counts traffic second by second and detects attacks on its own, even when the control server is down. Aggregate counters, events and top lists go to the portal. Individual packets and connection records never leave the DDoS processor.
5 s from the start of an attack until it is recorded; dropping starts from the first packet detection every second
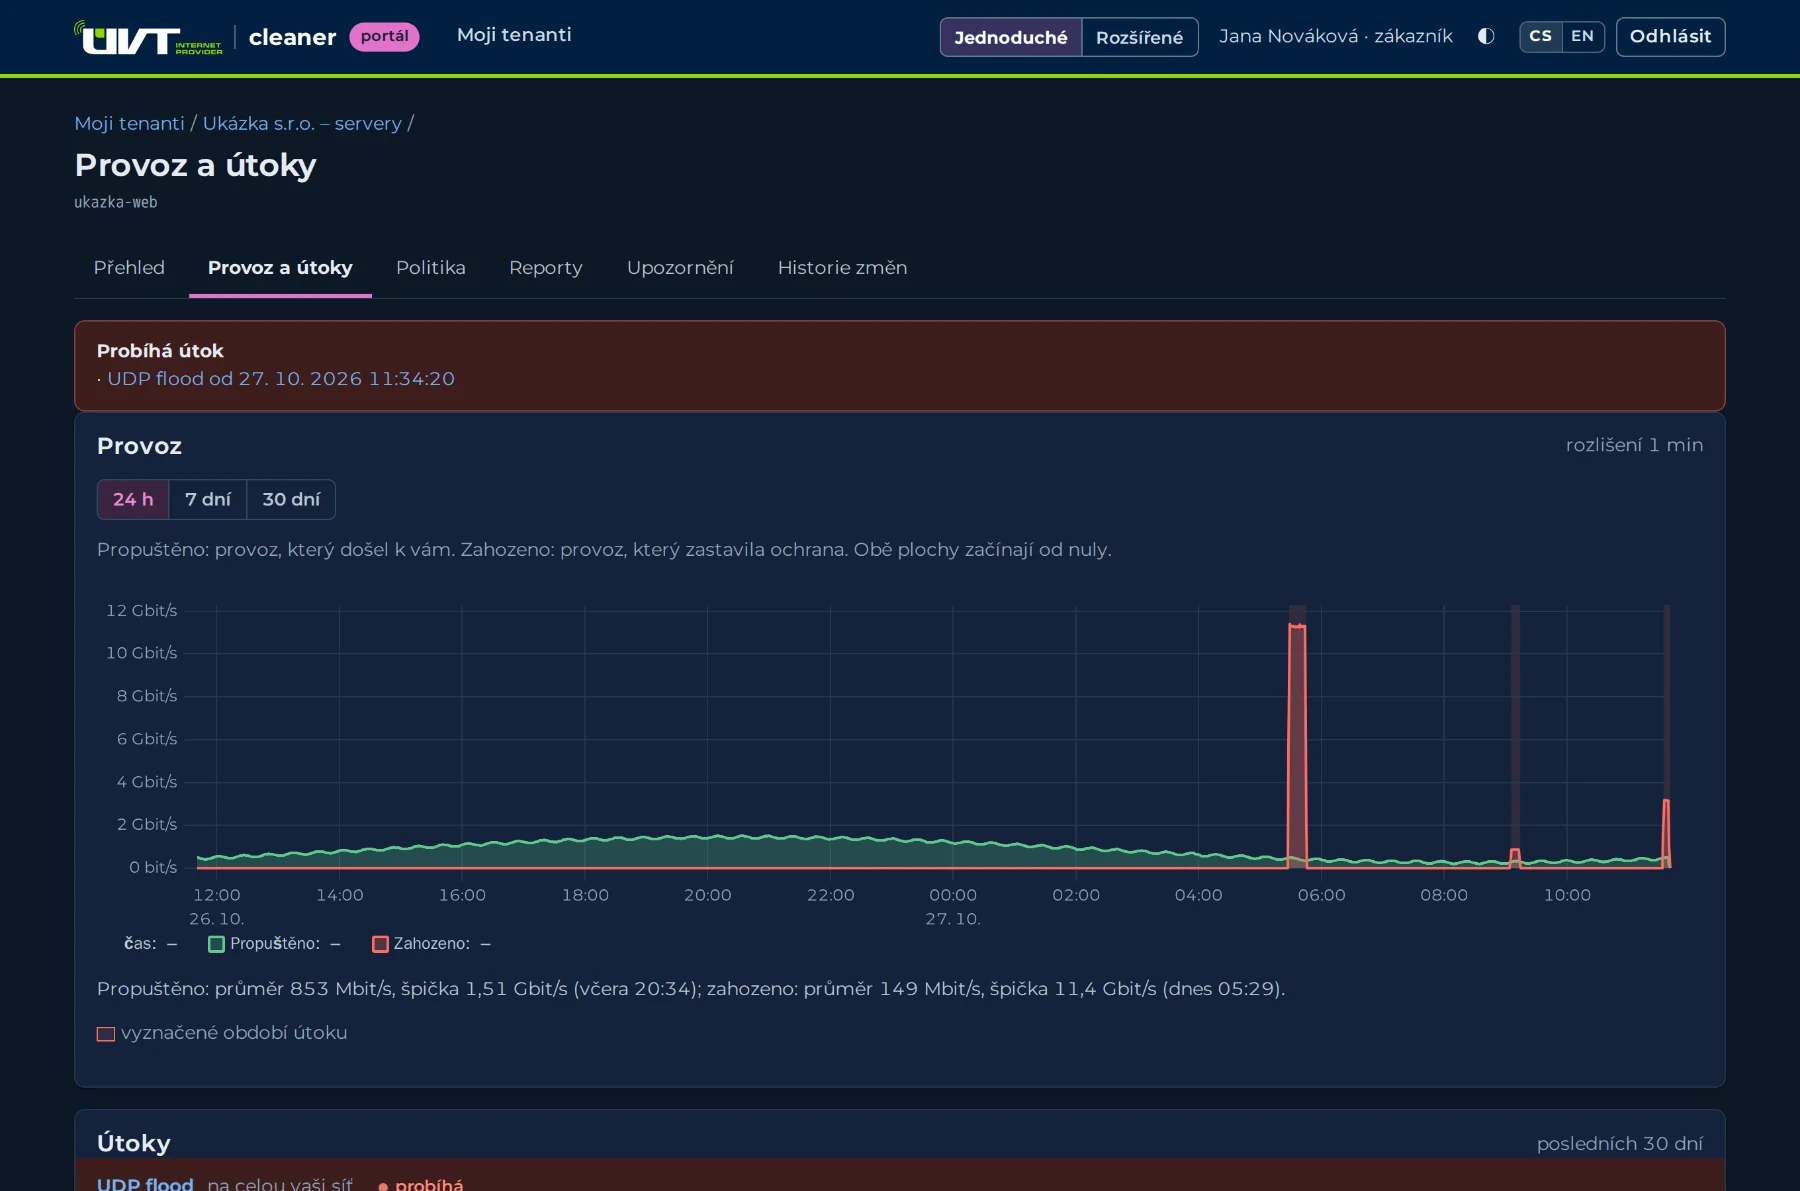
Traffic second by second. Received, passed and dropped, in packets and bits per second, IPv4 and IPv6 separately. Short periods per second, longer ones per minute. 13 months of history.
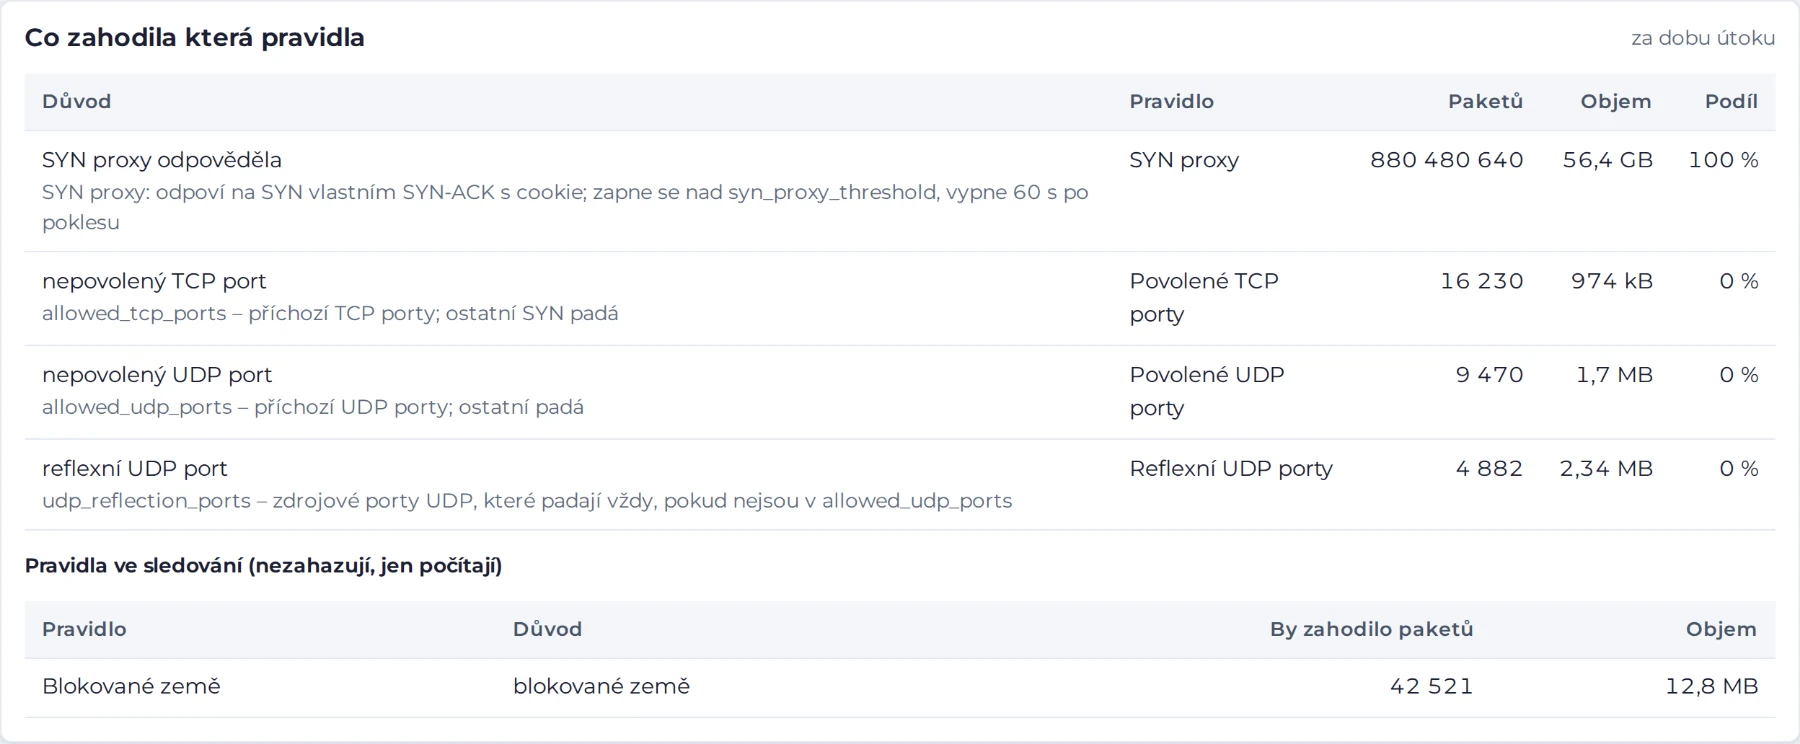
Why traffic was dropped. Dropped traffic by attack type and by specific rule. You know how much the SYN proxy stopped, how much the amplification filter and how much the blocklist.
Monitor-mode hits. Rules in monitor mode only count what they would drop. Before you switch them on, you see their impact on real traffic, including as a preview over the last 7 days.
Attacks. Detection every second at host, prefix and whole-network level, including “carpet bombing”. Attack type, target, start and end, peak and volume.
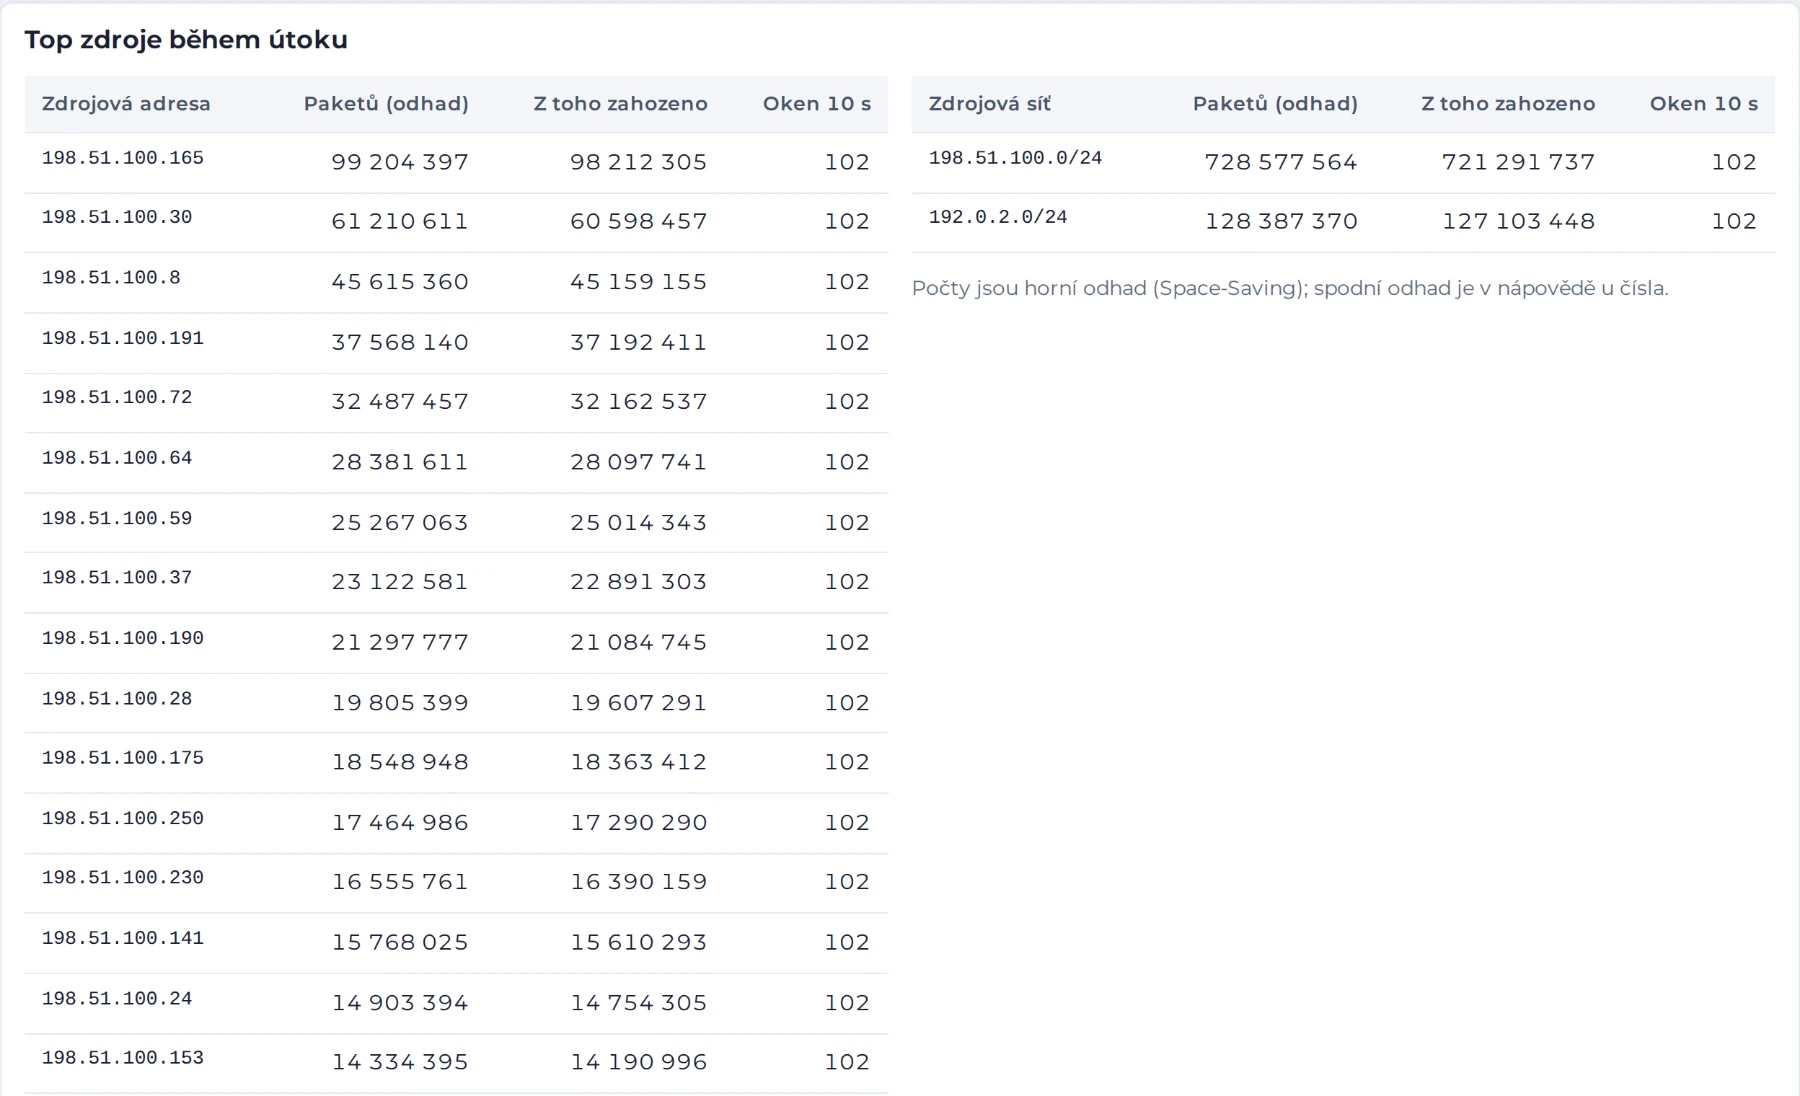
Where the attack came from. During an attack, the top 50 source addresses and 50 networks (/24, IPv6 /48) at 10 s intervals. Useful for the blocklist and for abuse reports. We keep them for 90 days.
Connections. The number of active connections by kind (established, half-open, closing, UDP) and their limit. You can see the table filling up before it overflows.
DNS. Checked queries, zones under attack, number of known names. During an attack, the top zones, names and query sources.
Your line. Status of the line and of the BGP sessions (IPv4 and IPv6) to your CPE. Without the technical details that only our operations team needs.
Recommended limits. We propose limits based on 30 days of attack-free traffic. With one click you take them over into monitor mode and switch them on once verified.
Simple or in detail: your choice
The portal has two views. Simple tells you in one sentence whether you are protected and shows traffic and attacks in plain terms. Advanced adds charts by attack type, protocol and rule, connections, attack sources and the policy editor. The switch is in the header and your choice is saved to your account.
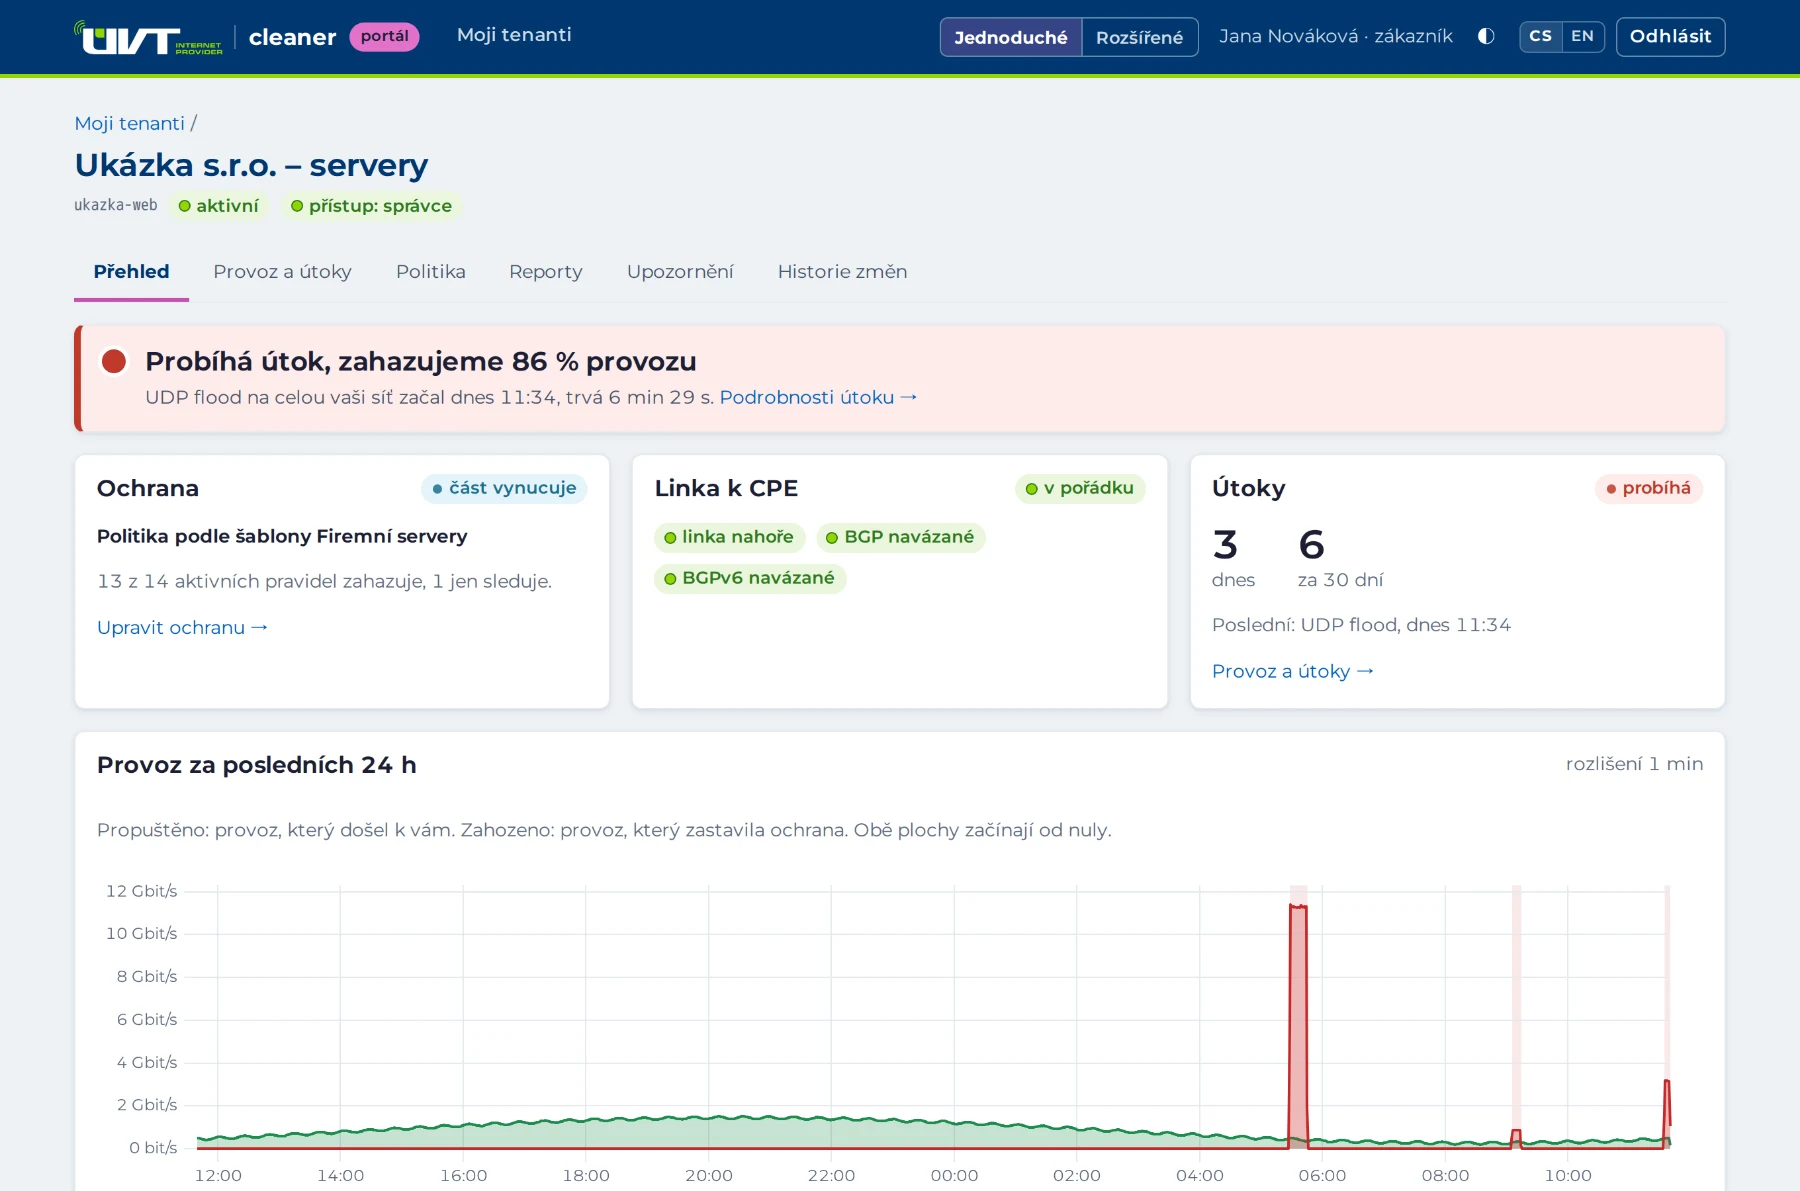
An overview in one sentence
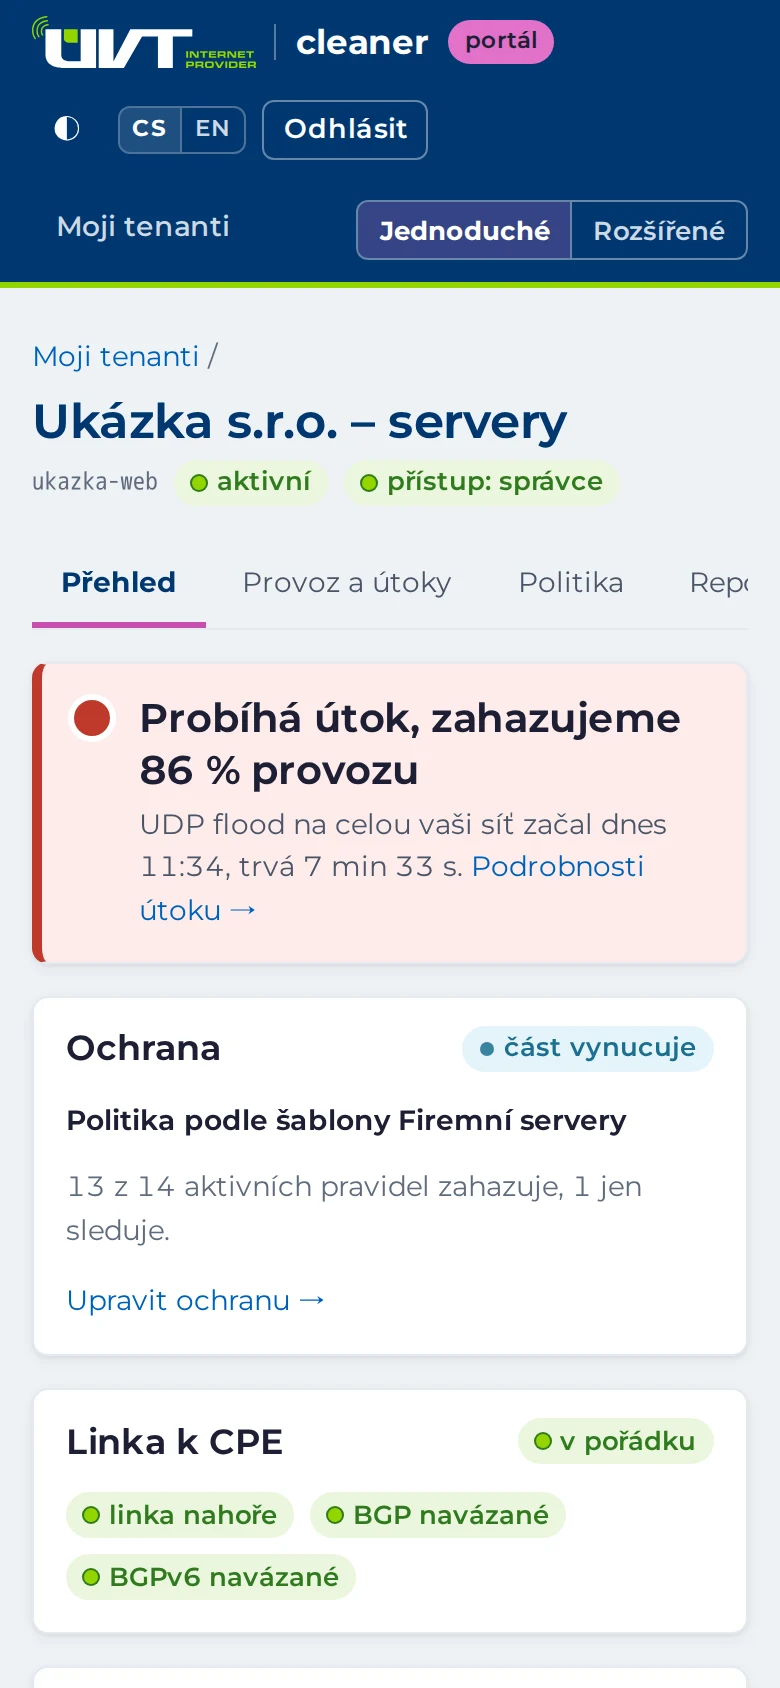
A traffic light at the top shows the status: Protected, Monitoring only or Attack in progress, dropping 87% of traffic. Below it are tiles for protection, the line and attacks, plus traffic for the last 24 hours.
- Attacks in plain language: type, target, when, how long, peak, how much we dropped
- Where telemetry is missing, the portal says so instead of drawing a zero
- Czech and English, light and dark themes, on a phone or on a monitor
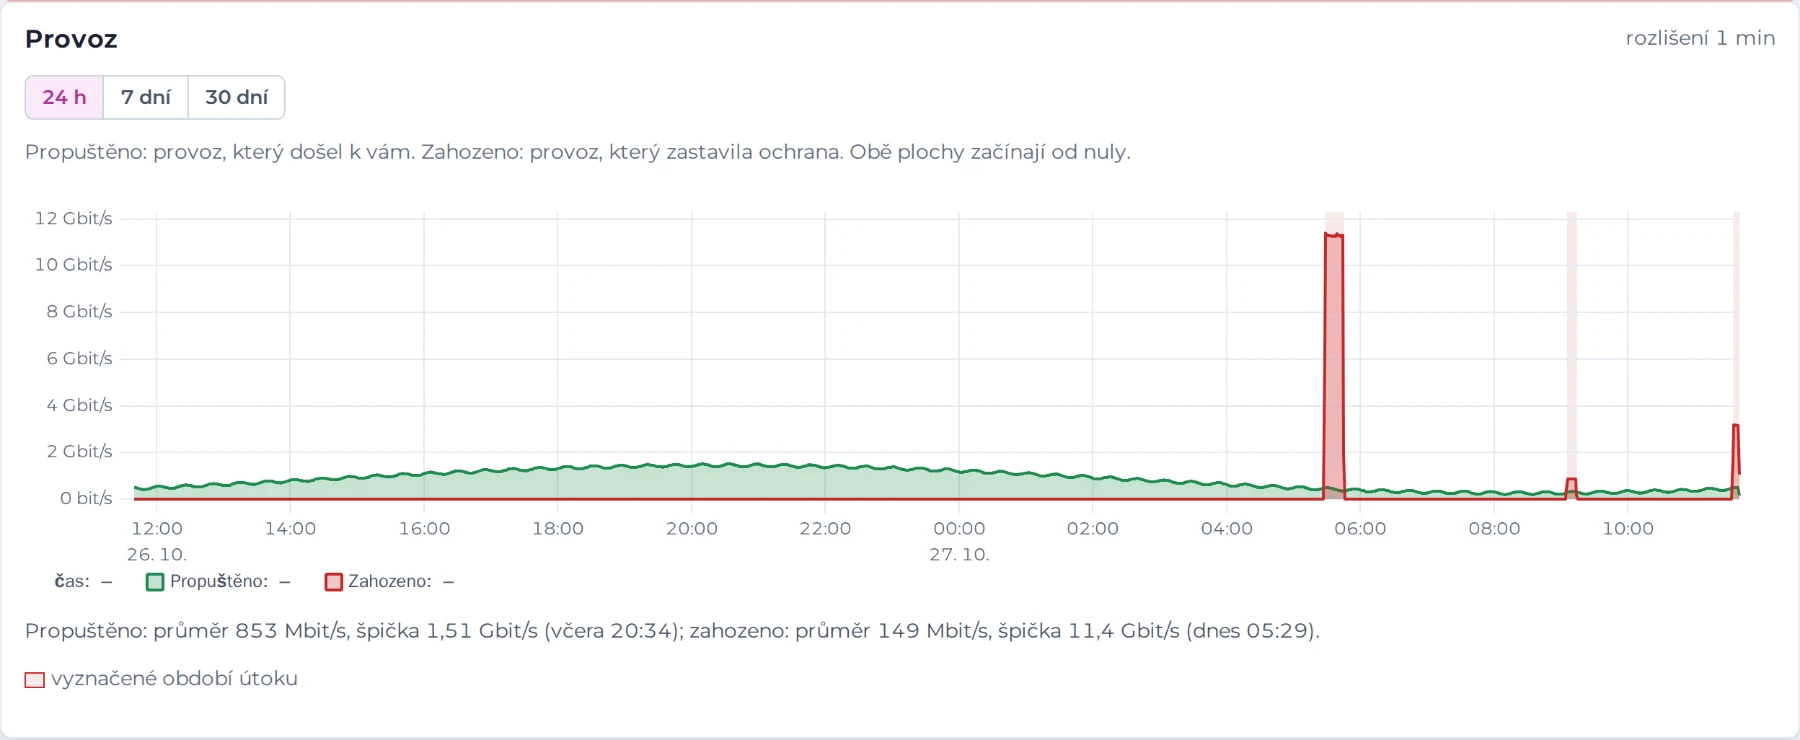
Traffic in detail
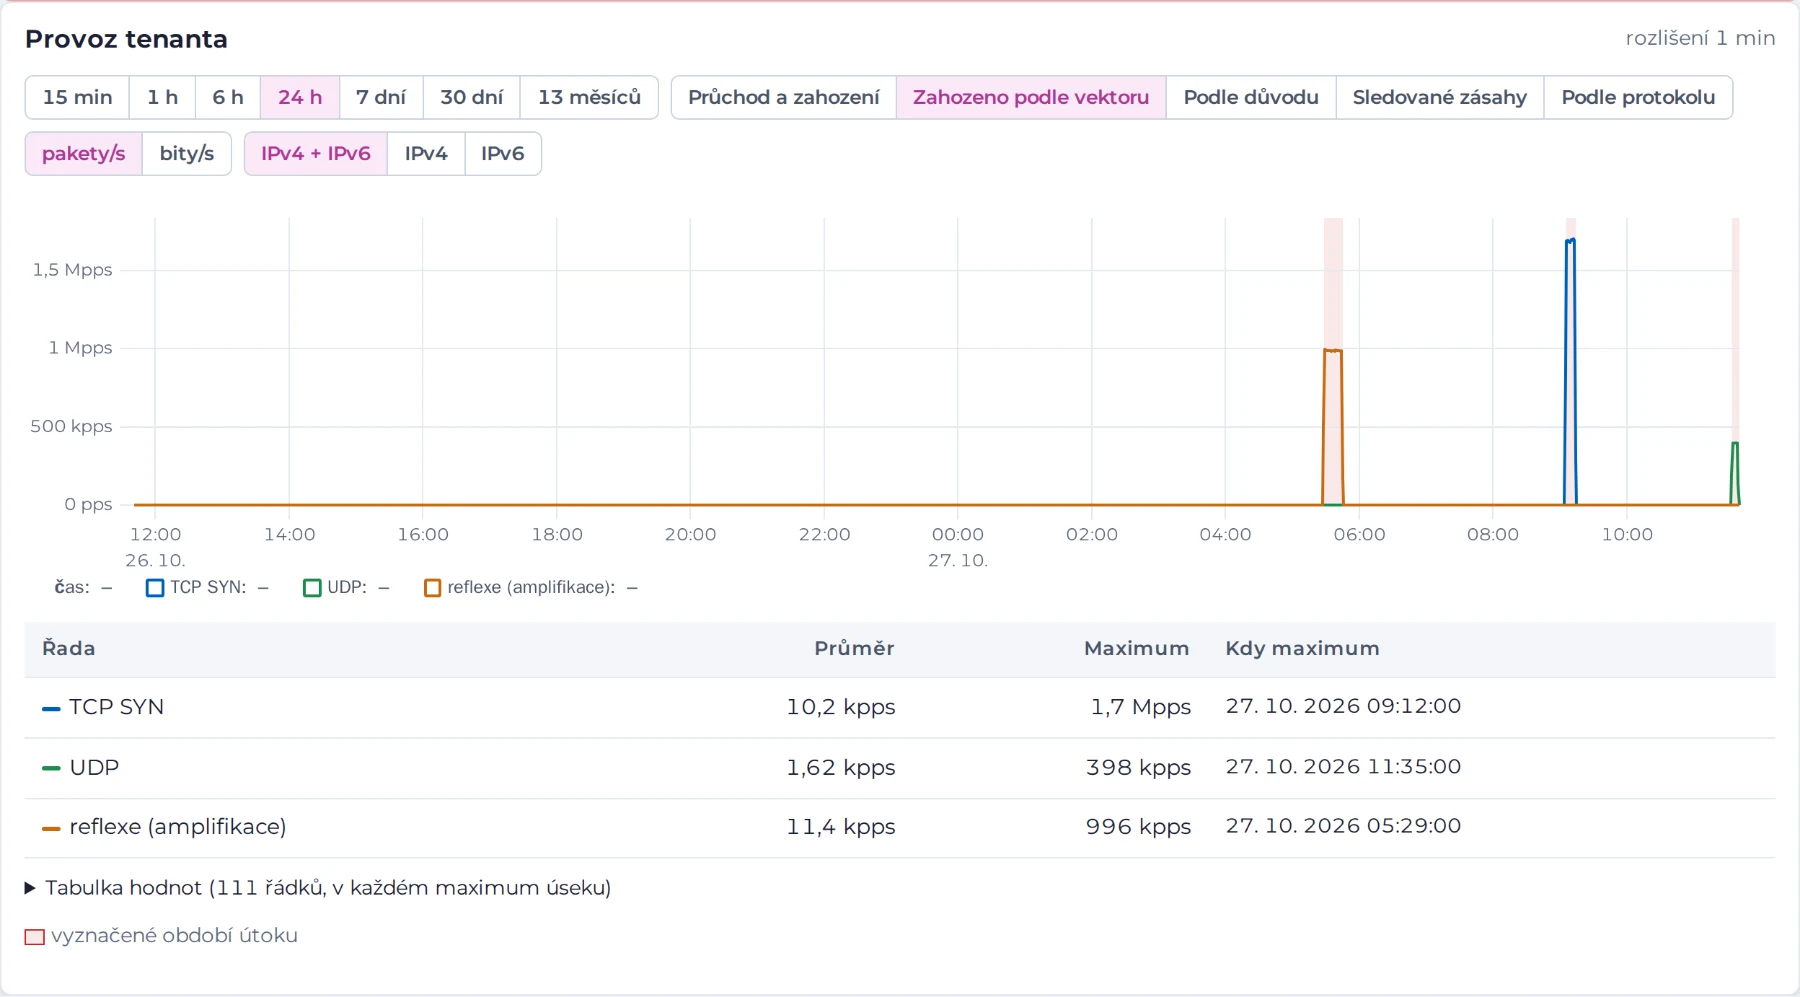
The advanced view shows the same traffic from several angles: passed and dropped, dropped by attack type, by reason, monitor-mode hits and traffic by protocol. Packets and bits, IPv4 and IPv6, from 15 minutes to 13 months.
- The time range is in the page address, so you can send the link to a colleague
- Turn series on and off in the legend, with the values also in a table
- 1 s resolution for short periods, such as the course of an attack
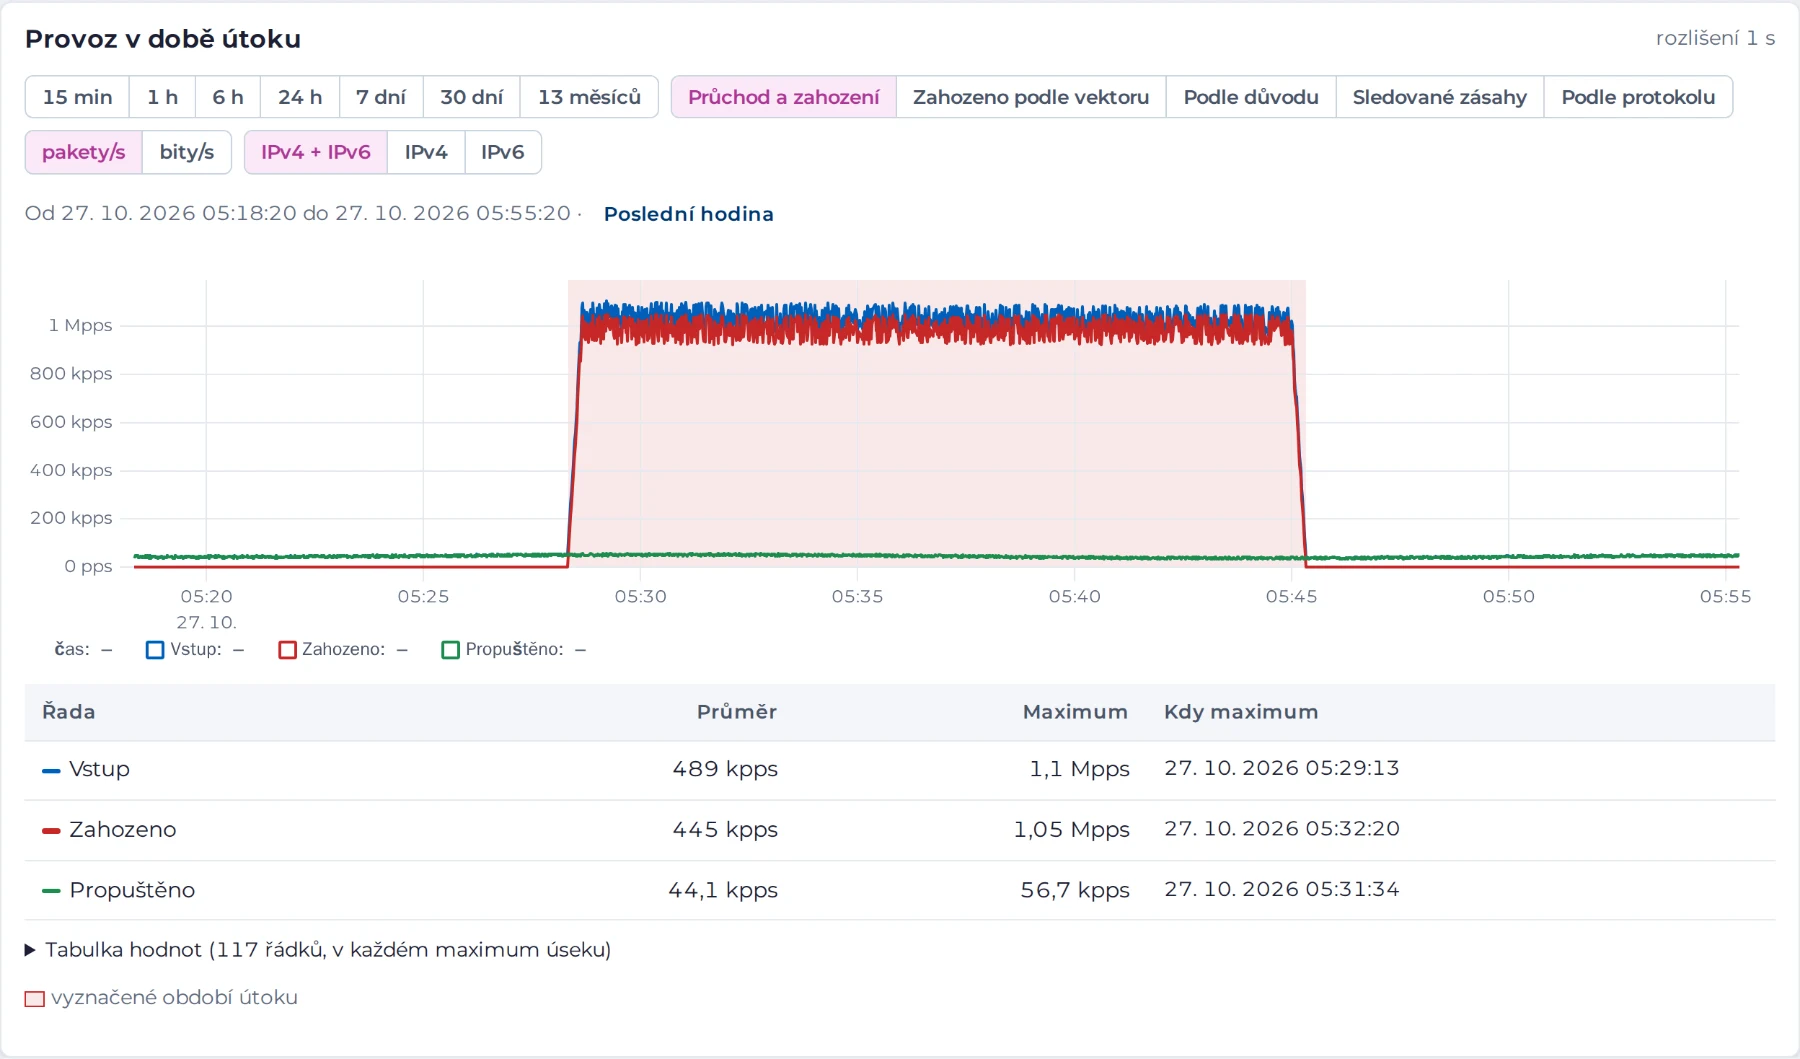
Details of every attack
For every attack, a chart from ten minutes before it to ten minutes after it, and a table of what each rule dropped. For amplification, also a ranking of the abused servers and of the networks the attack came from.
- Type, target (address, prefix, whole network), start, end, peak, volume
- Rules that dropped traffic and rules that only monitored
- Top sources and source networks, useful for the blocklist and for abuse reports
DNS server protection
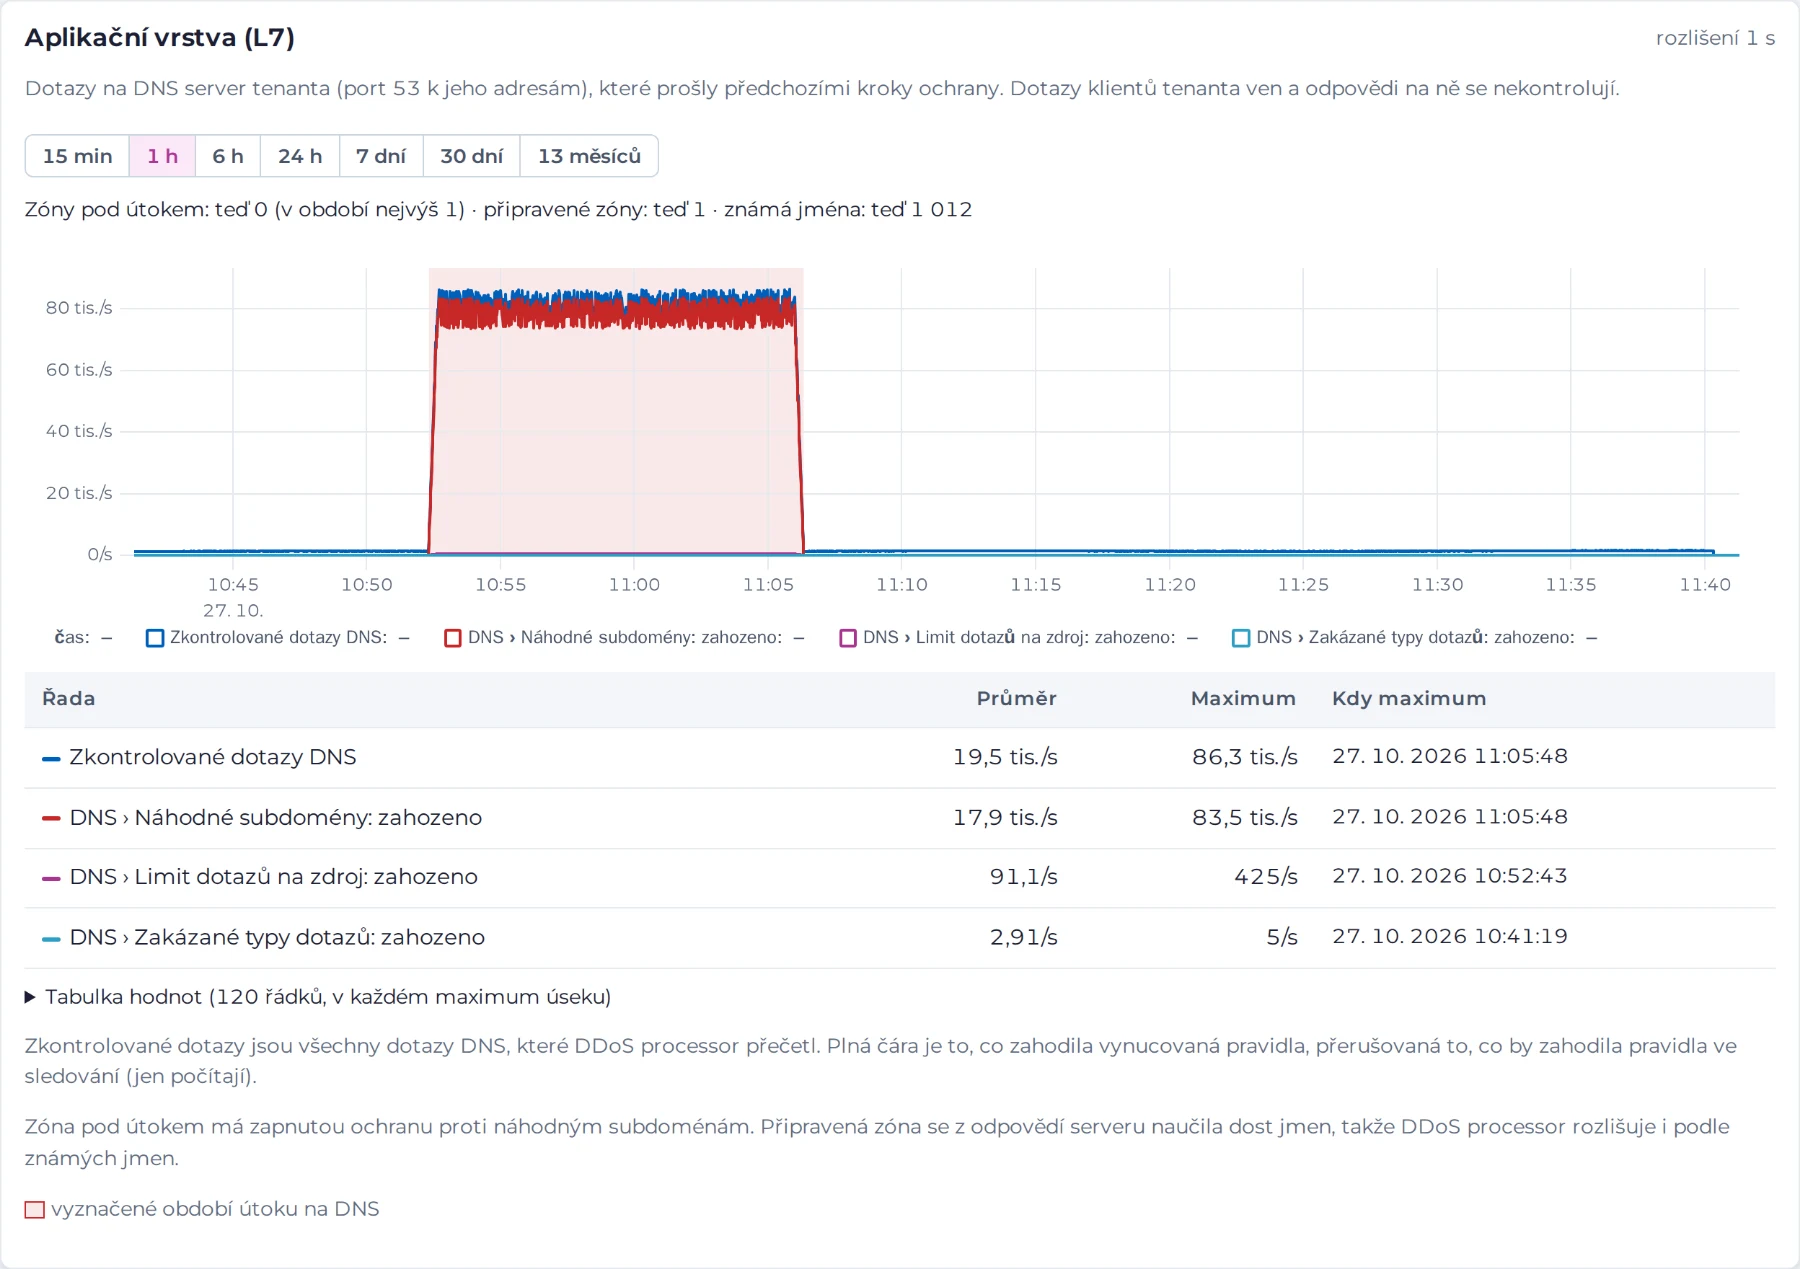
For authoritative DNS, the DDoS processor watches each zone separately. When a zone comes under a random subdomain attack, it drops unknown random names. It has learned the names your server really serves from the server's responses and lets them through.
- Checked queries per second, dropped by rule
- Zones under attack, prepared zones, number of known names
- Top zones, names and query sources during an attack
99.5% of a random subdomain attack dropped at 100,000 queries/s, legitimate queries answered lab, 12 Oct 2026
In the lab: at 100,000 queries/s of random names, 99.34–99.53% of the attack was dropped and 99.94–100% of legitimate queries were answered within 1 s (p99 3.3 ms).
ukazka.example zone.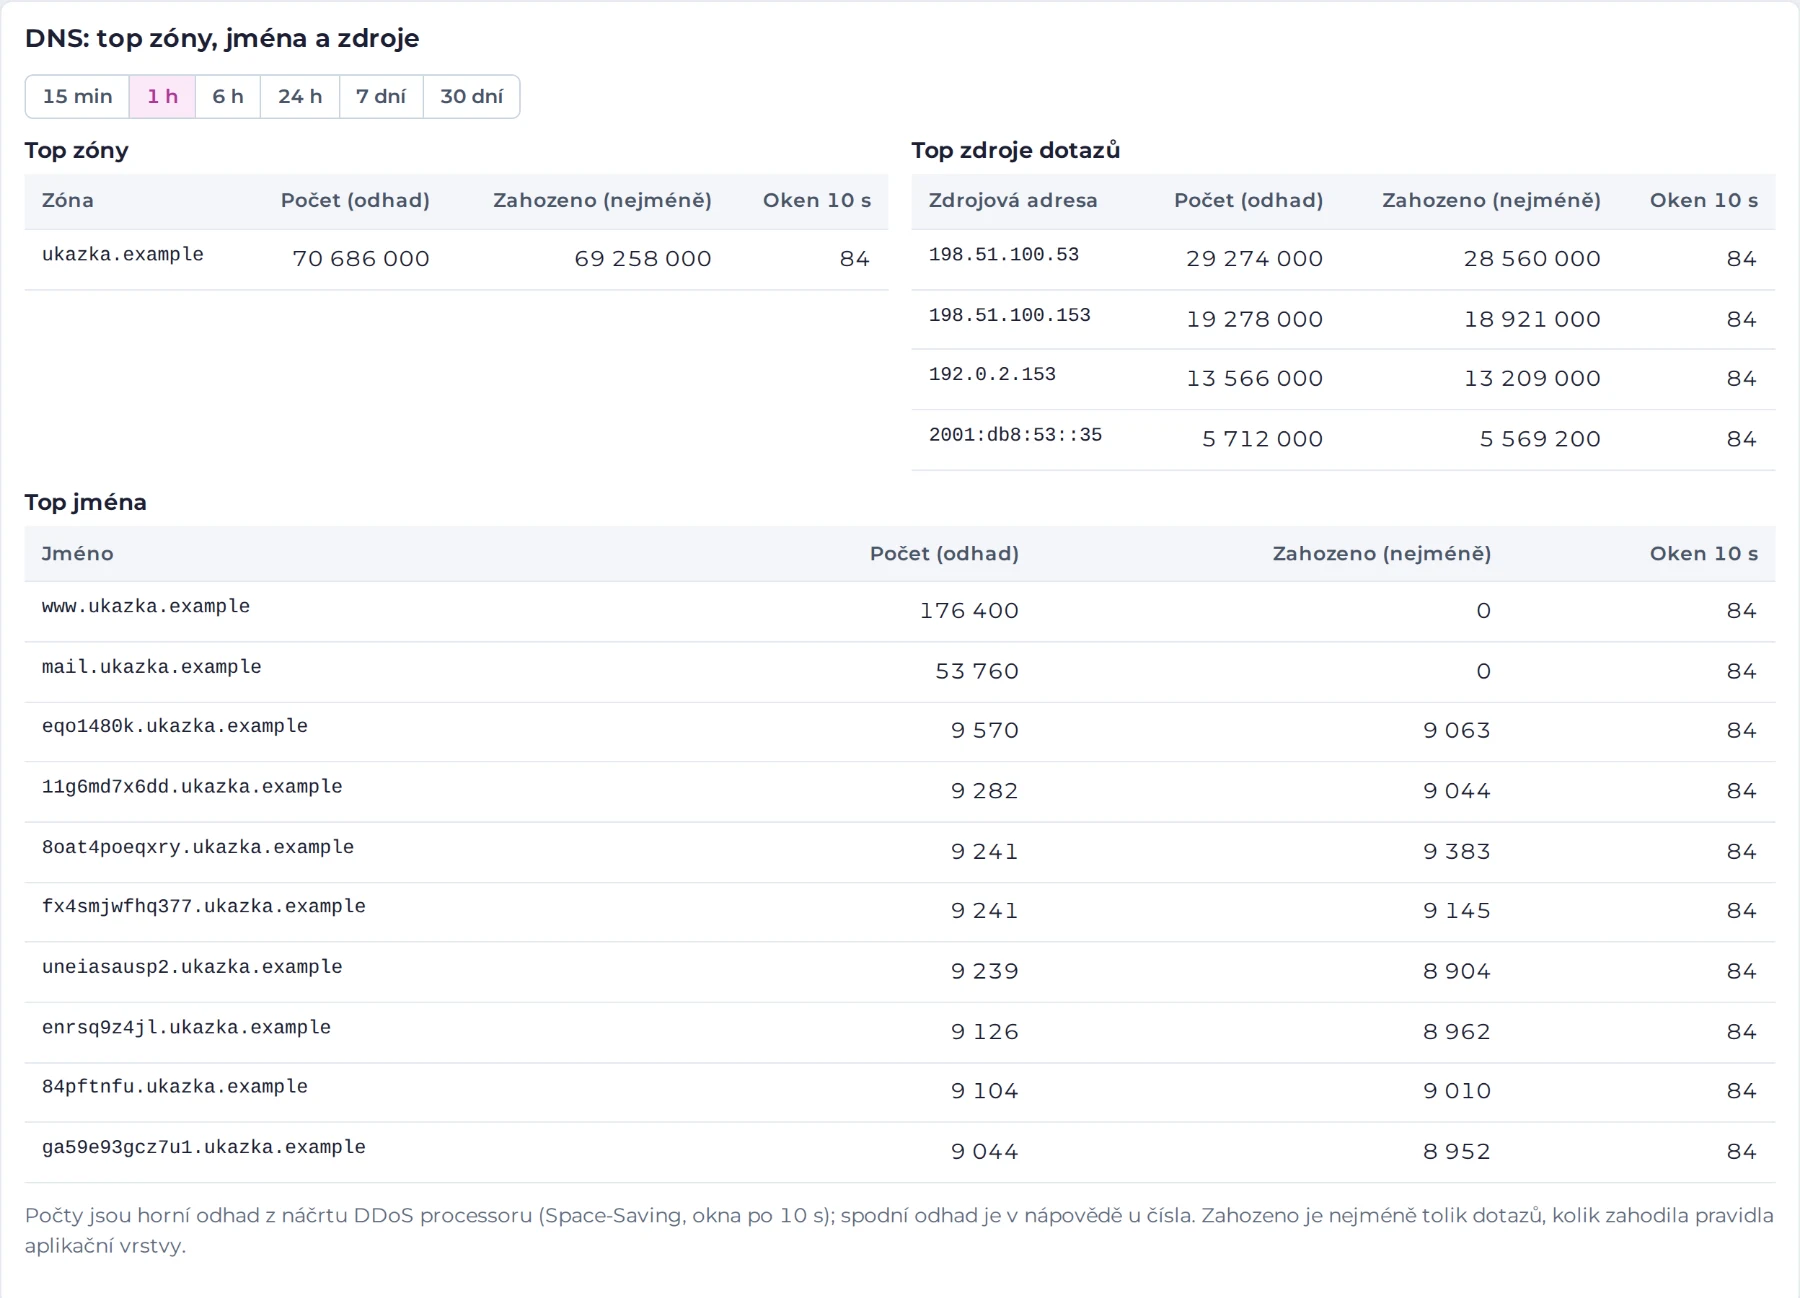
www and mail get through.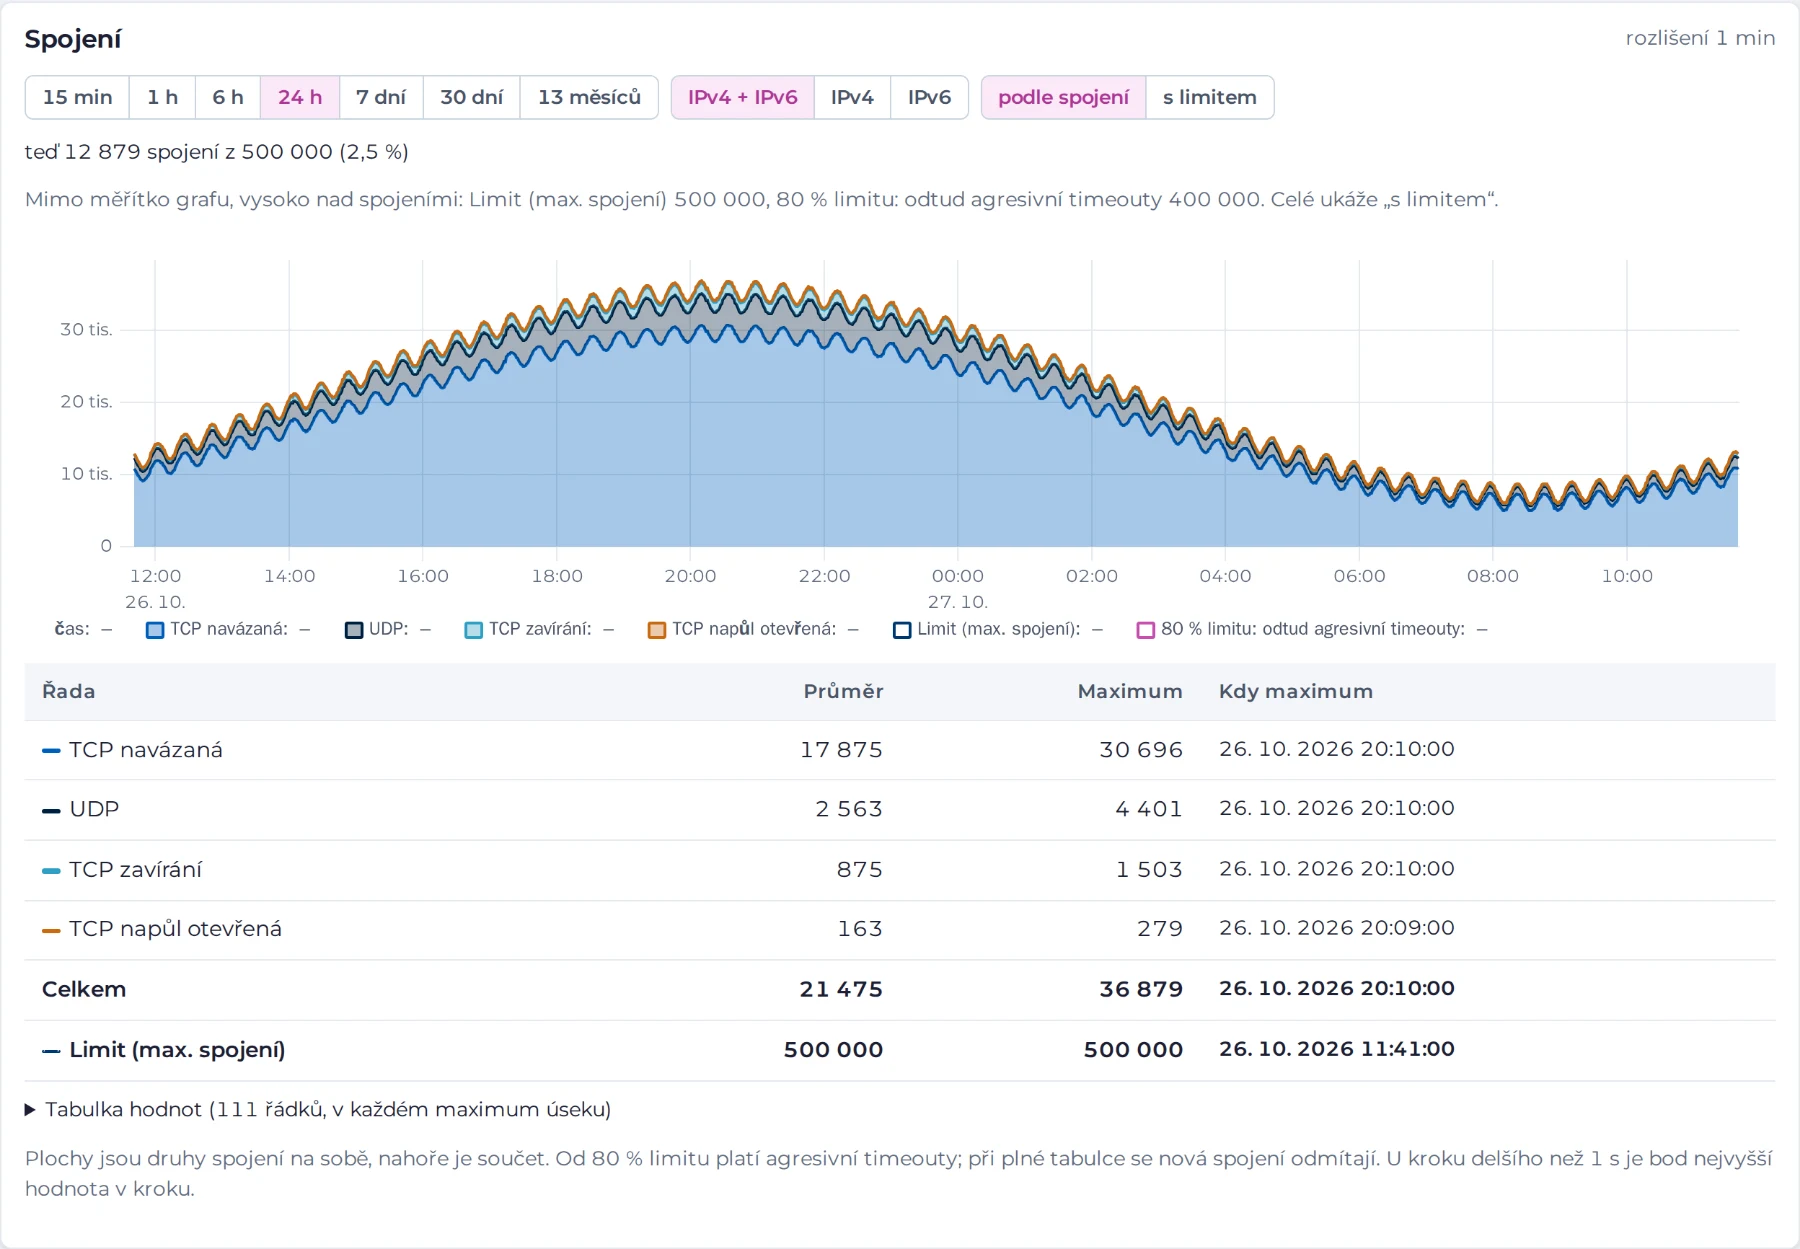
Wherever you are
The portal works on your phone just as it does on a monitor. It is available in Czech and English, with a light or dark theme that follows your system.
- Sign-in with a second factor: a code sent by e-mail
- One account for multiple tenants, with different access levels
- Your choice of view and language is saved to your account
Your rules, safely and with a full history
You manage your protection policy yourself in the portal. You start with a template for your type of services, every new rule only monitors at first, and switching to live enforcement is always your decision.
A template and a single switch
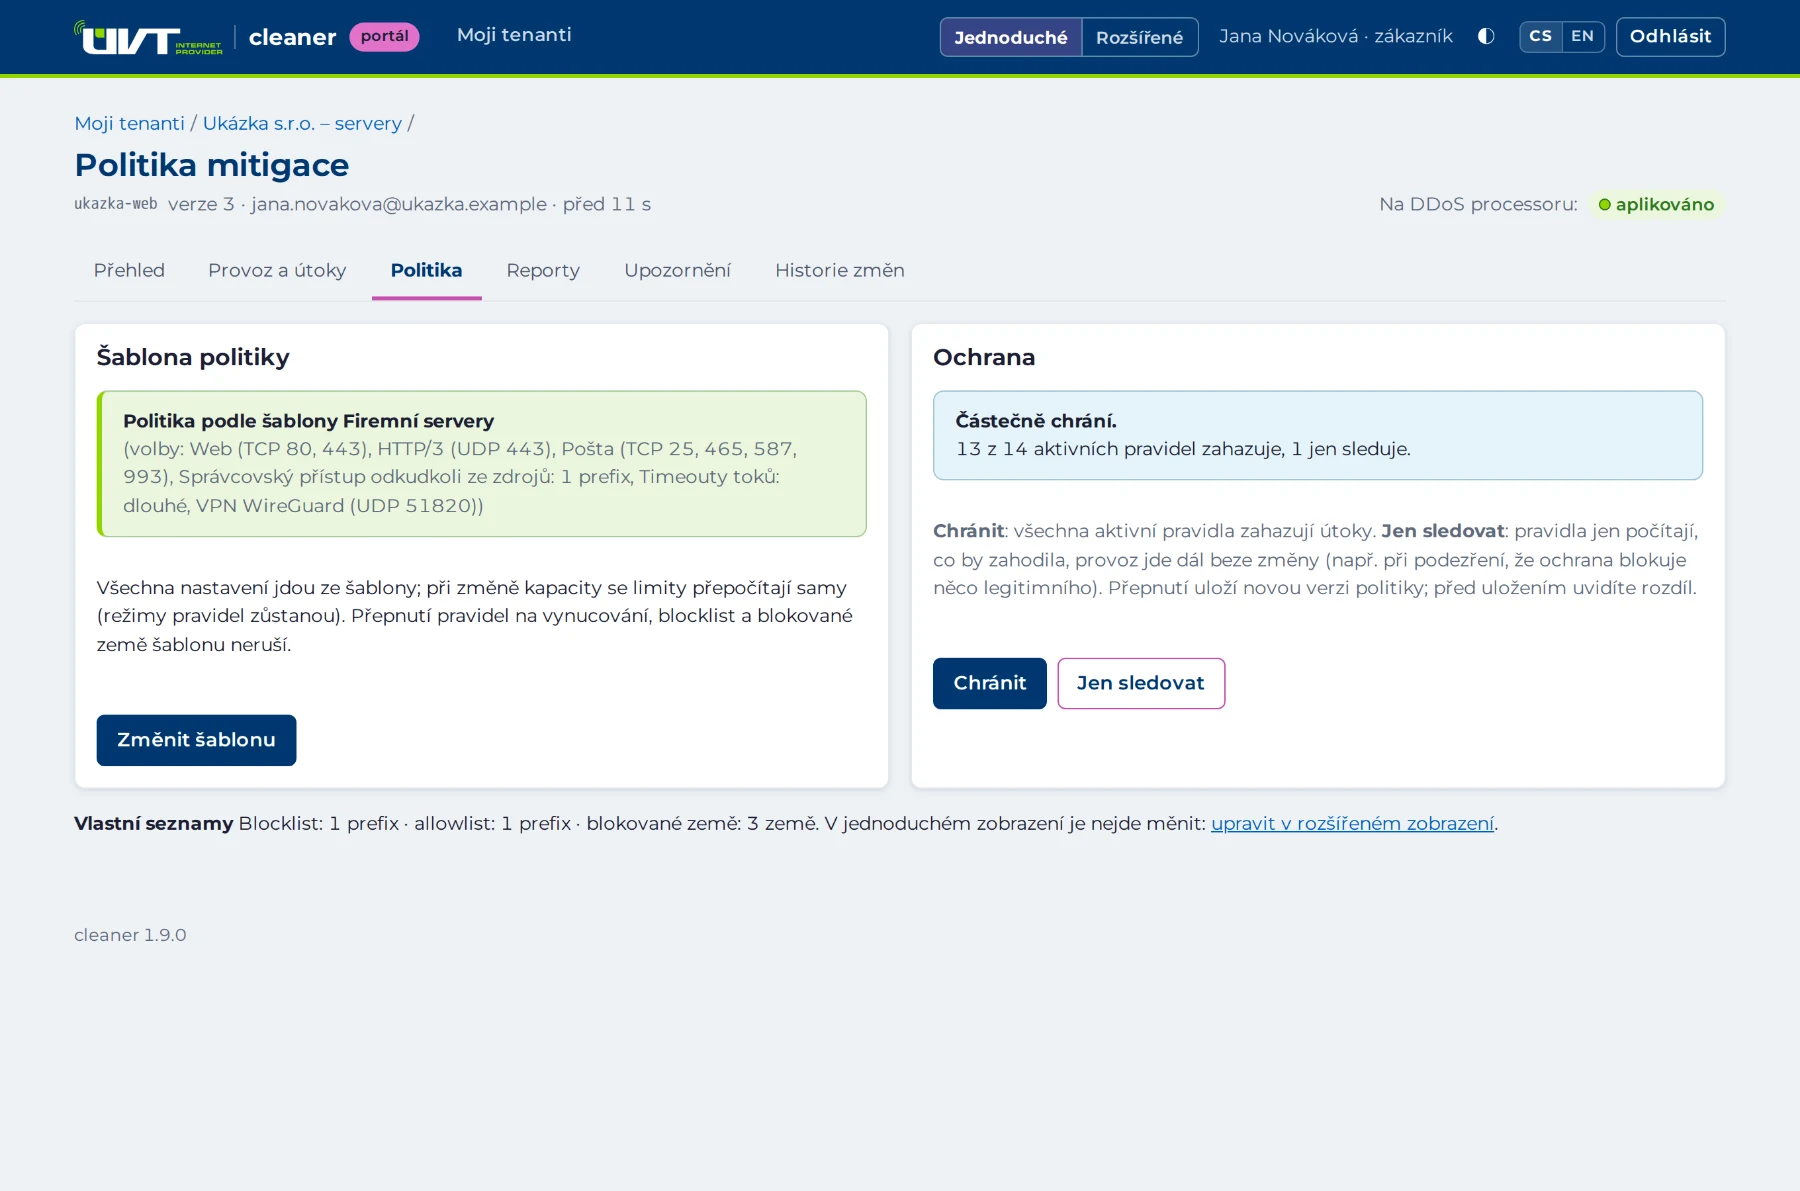
In the simple view you pick a template, tick your services (web, e-mail, VPN…) and use the Protect / Monitor only switch to decide whether the rules drop traffic. The template calculates the limits from your contracted capacity and shows the formula behind every number.
- Before saving, you always see the difference from the current version and confirm it
- “Monitor only” does not switch off basic protection: packet checks and capacity still apply
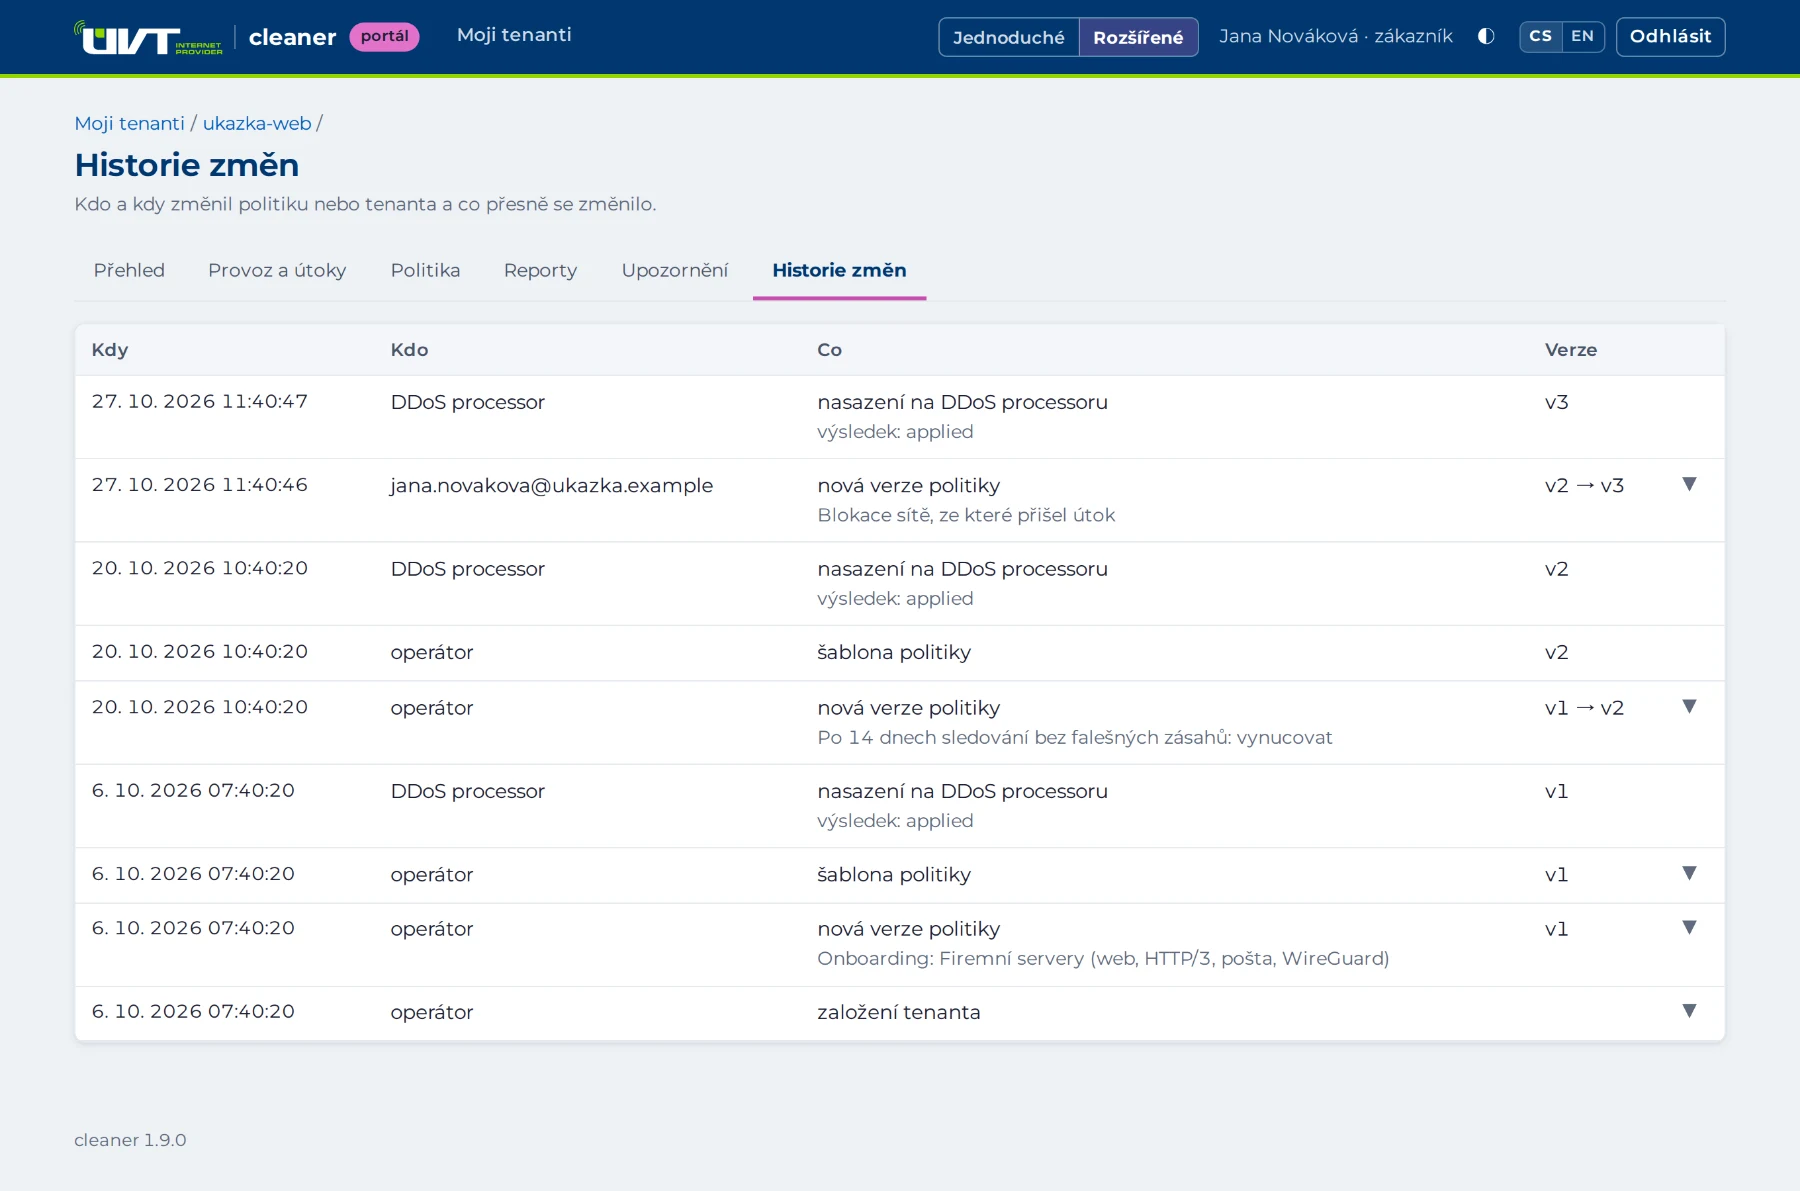
- Every change is a new version, and you can go back to the previous one with one click
Templates for common services
- Office
- No public services: people just work, send e-mail and make calls. All connection attempts from outside are dropped.
- Web
- TCP 80 and 443, optionally HTTP/3. The SYN proxy switches on only during an attack; amplification and other UDP are dropped.
- Company servers
- Web, e-mail, VPN (IPsec, WireGuard, OpenVPN) and your own ports. Remote access for administrators from their networks.
- DNS server
- Authoritative, optionally also a recursive resolver. A limit on port 53 and DNS application layer rules for your zones.
- Voice and gaming
- SIP PBXs and game servers on UDP. An RTP port range, each service with its own limit.
- Basic protection
- For networks with unknown services (e.g. ISPs): ports are not restricted, amplification and fragments are dropped, limits are based on capacity.
What you set yourself
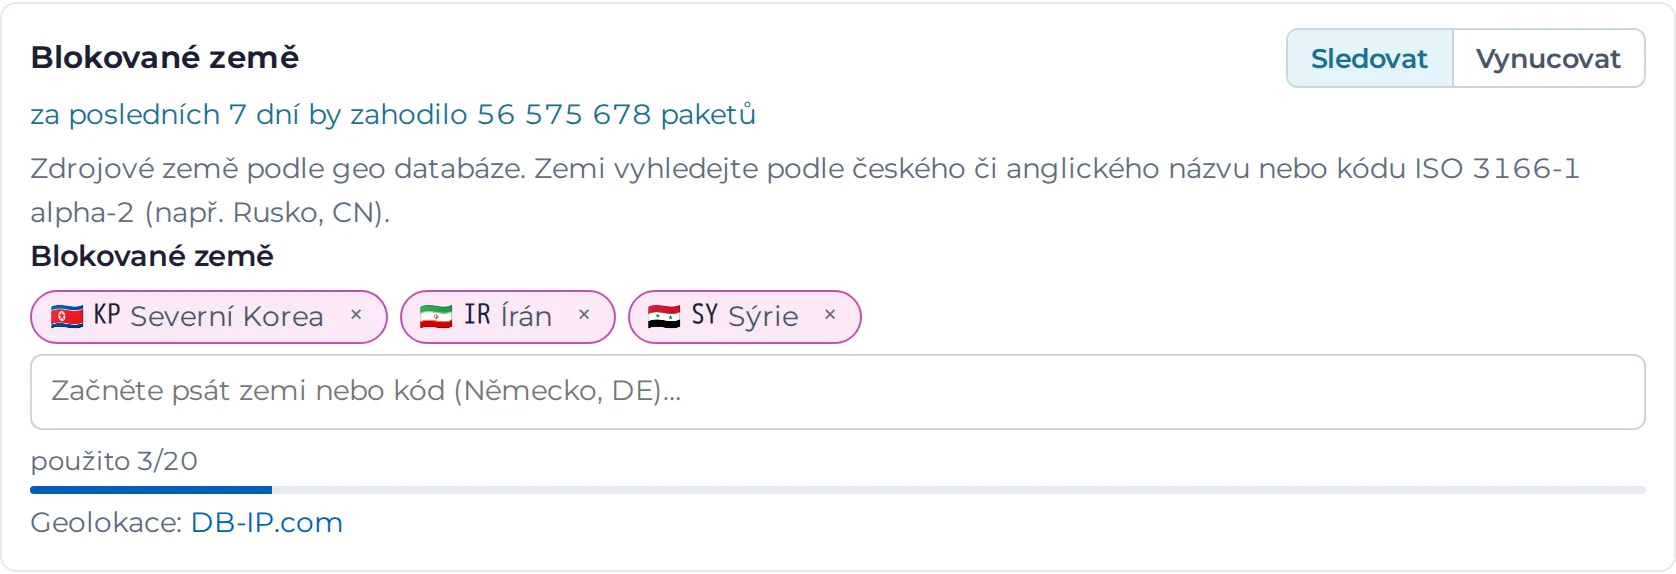
- Blocklist and allowlist of source networks, country geoblocking
- Allowed protocols, TCP and UDP ports, amplification filter
- Limits: new connections (SYN/s), UDP per port, UDP bit/s, ICMP, other protocols
- Connection tracking and SYN proxy, connection timeouts
- DNS rules: zones, query types, per-source limit, random subdomains
- Monitor / enforce mode for each rule
- Custom templates (up to 100 per account), usable for all your tenants
- E-mail alerts and report subscriptions
What we set for you
- Contracted capacity and quotas, prefixes, VLAN, BGP sessions
- Attack detection thresholds (20% of capacity by default, adjustable per prefix and host)
- Exceptions for shared addresses (CGNAT) in DNS rules
- Customer accounts and invitations
The server makes sure that rules do not exceed the capacity and quotas, that the allowlist does not overlap with your prefixes and that rules are switched on in the right order. It shows any error next to the specific field before you save.
| Prefixes in the blocklist / allowlist | 200 / 200 |
|---|---|
| Blocked countries | 20 |
| Entries in the port list | 64 |
| Connections in the table | 500,000 |
You find out straight away, plus a monthly summary
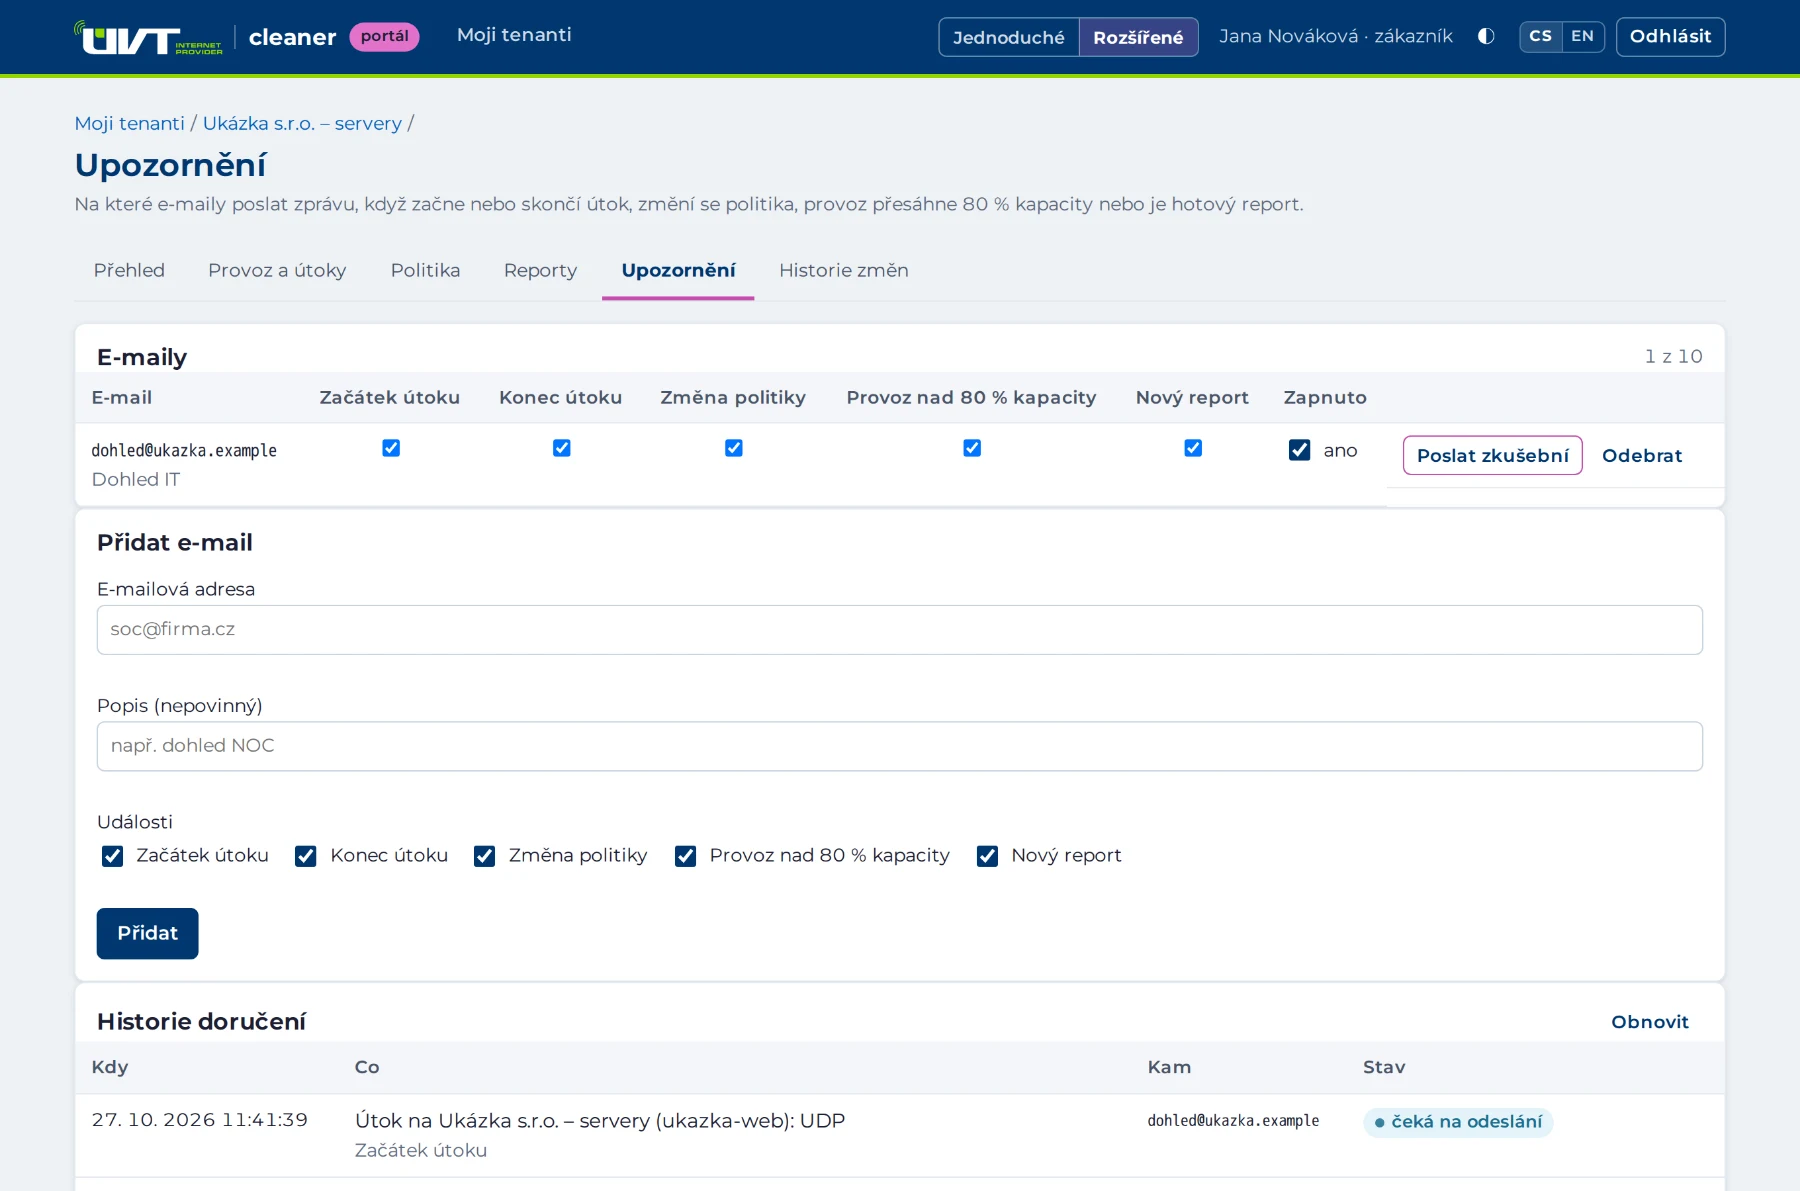
E-mail alerts
- Start and end of an attack
- Policy change (whoever made it)
- Traffic above 80% of the contracted capacity (five-minute average) and return below 70%
- New report, with the PDF attached
Up to 10 addresses per tenant, and you choose the events for each one separately. Send a test message with one button; the delivery history is in the portal.
PDF reports
- Monthly report: daily traffic, the busiest minute, dropped traffic by reason, attacks, policy changes, capacity utilisation (p95) and rules in monitor mode
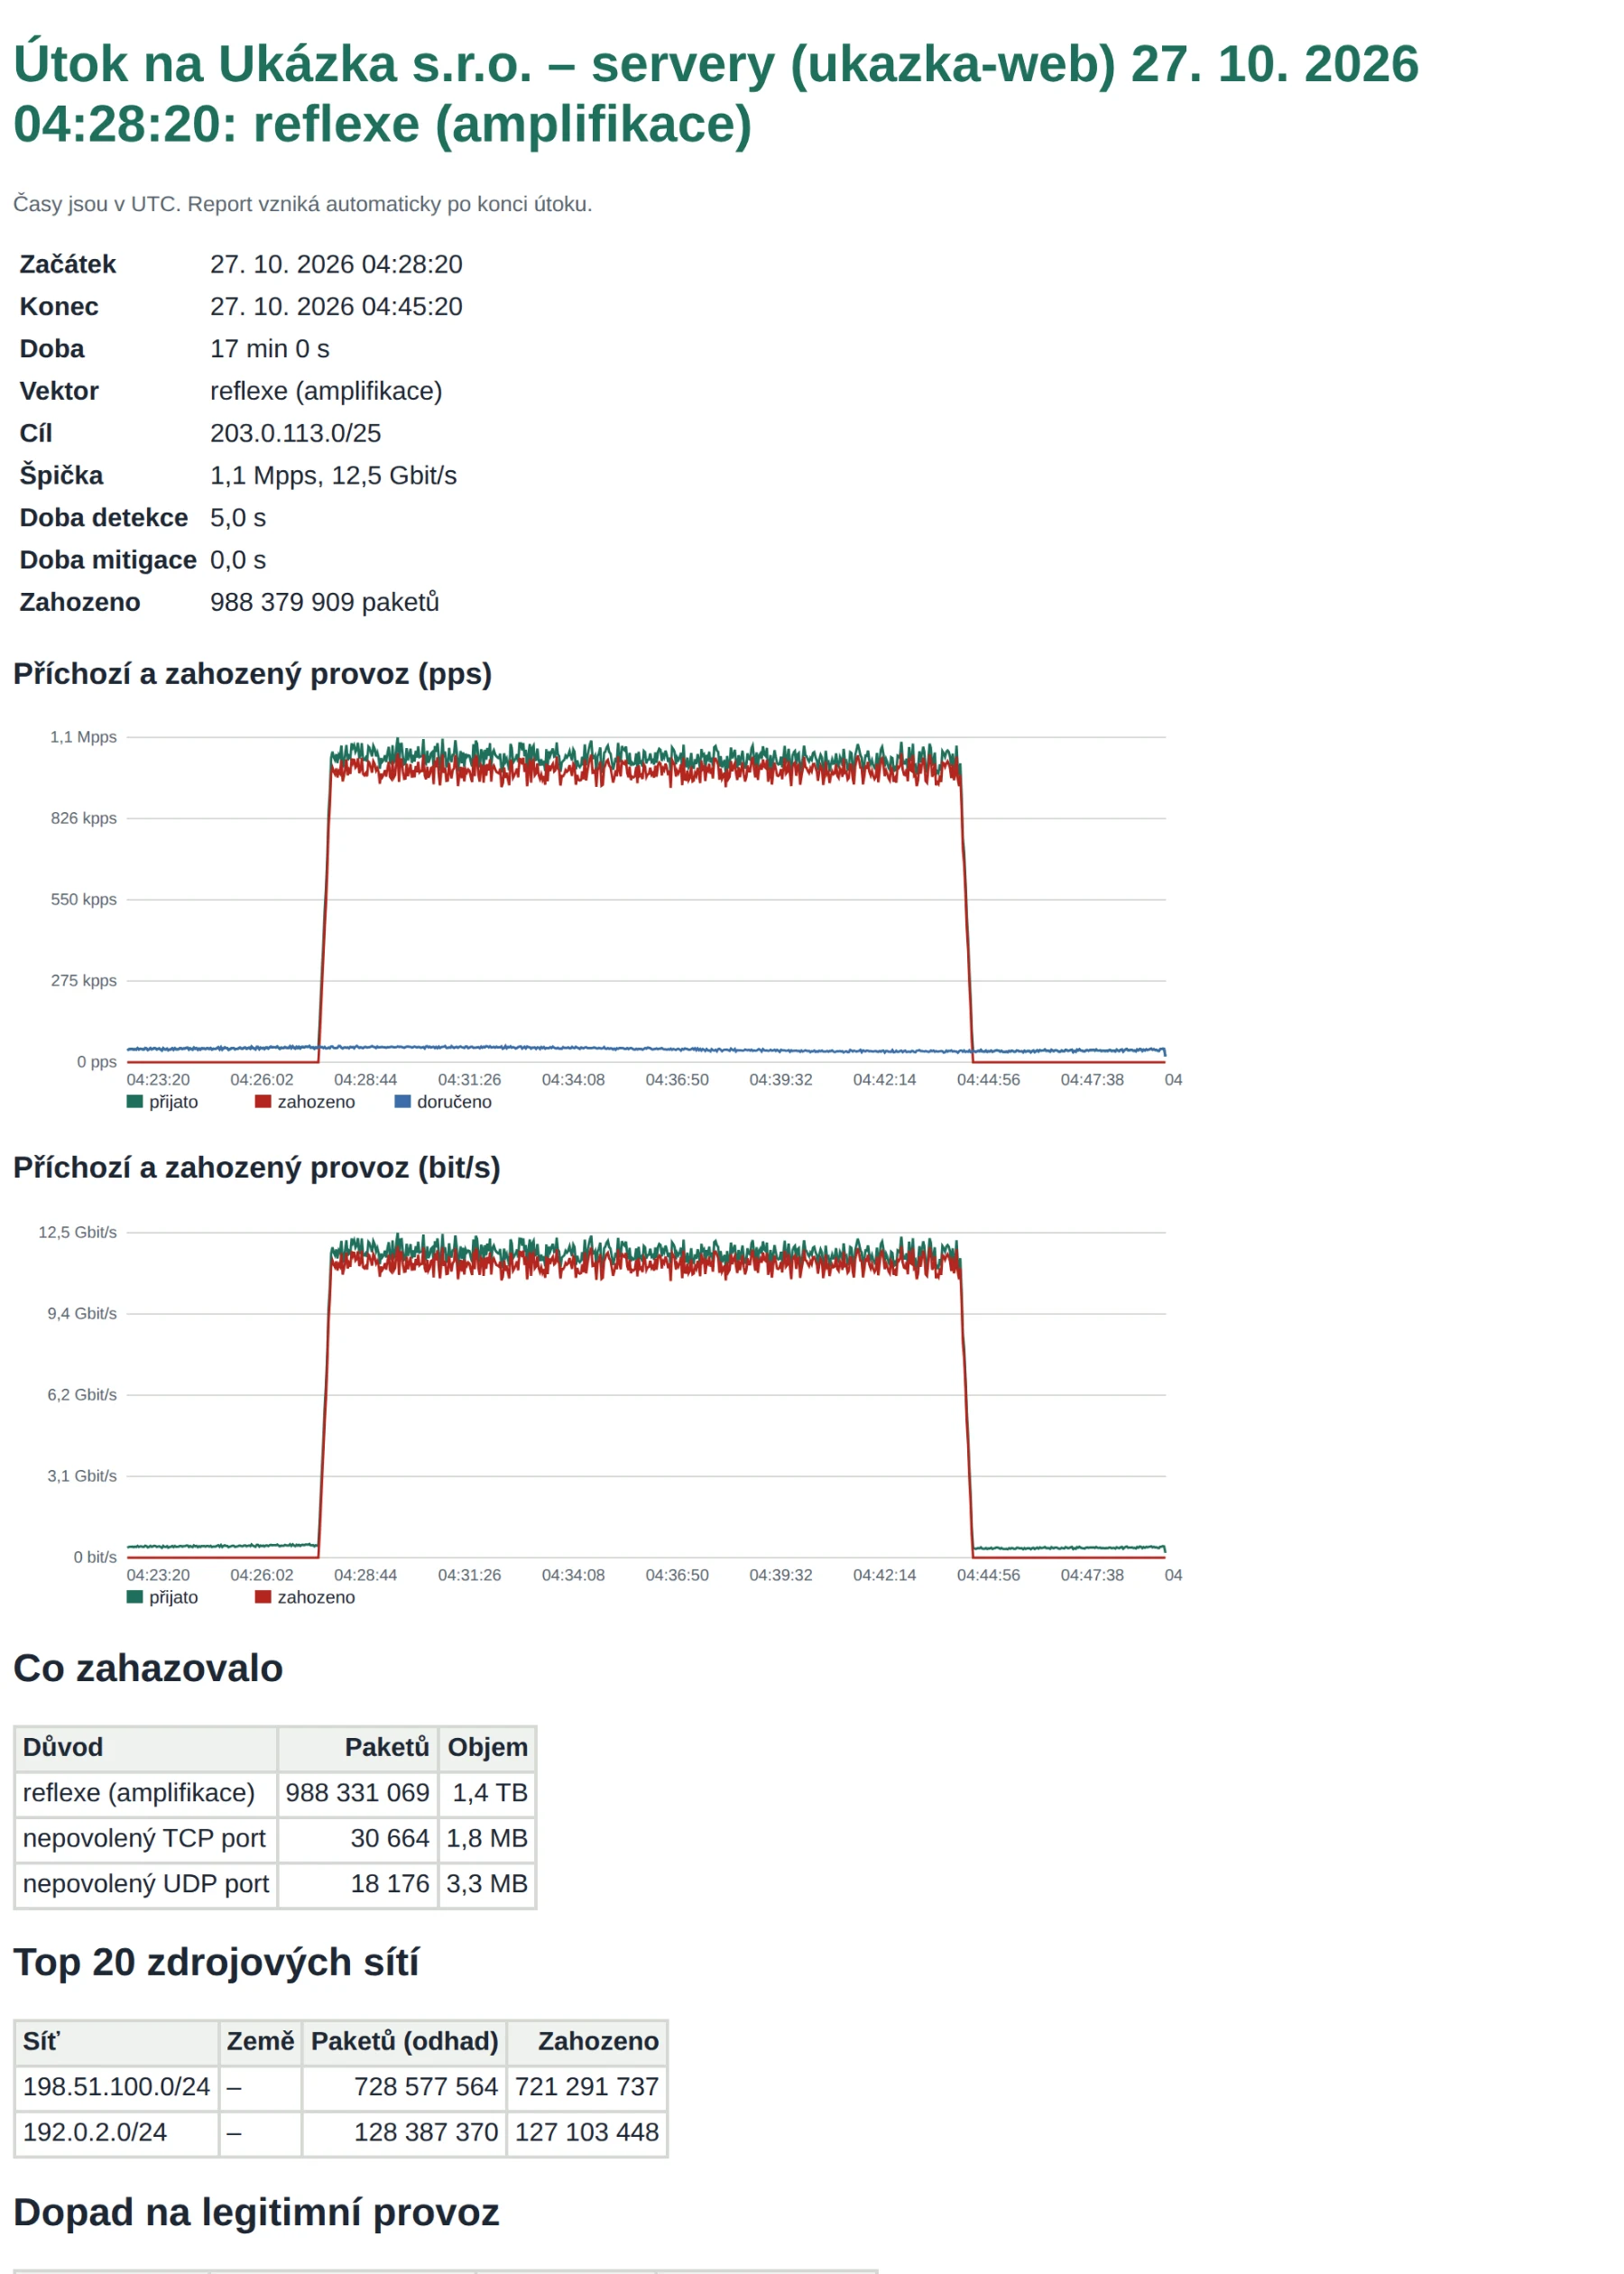
- Attack report a few minutes after the attack ends: its course, what was dropping traffic, top 20 source networks, traffic before, during and after the attack, time to detection and to mitigation
PDF with searchable text, and HTML. Kept in the portal for 13 months.
What we see
Our operators have their own console, accessible only from our network. They see the status of the DDoS processor, routing, policy deployment and the telemetry of all tenants. They put the DDoS processor into maintenance with one button: traffic moves to the backup path in a controlled way, with no outage.
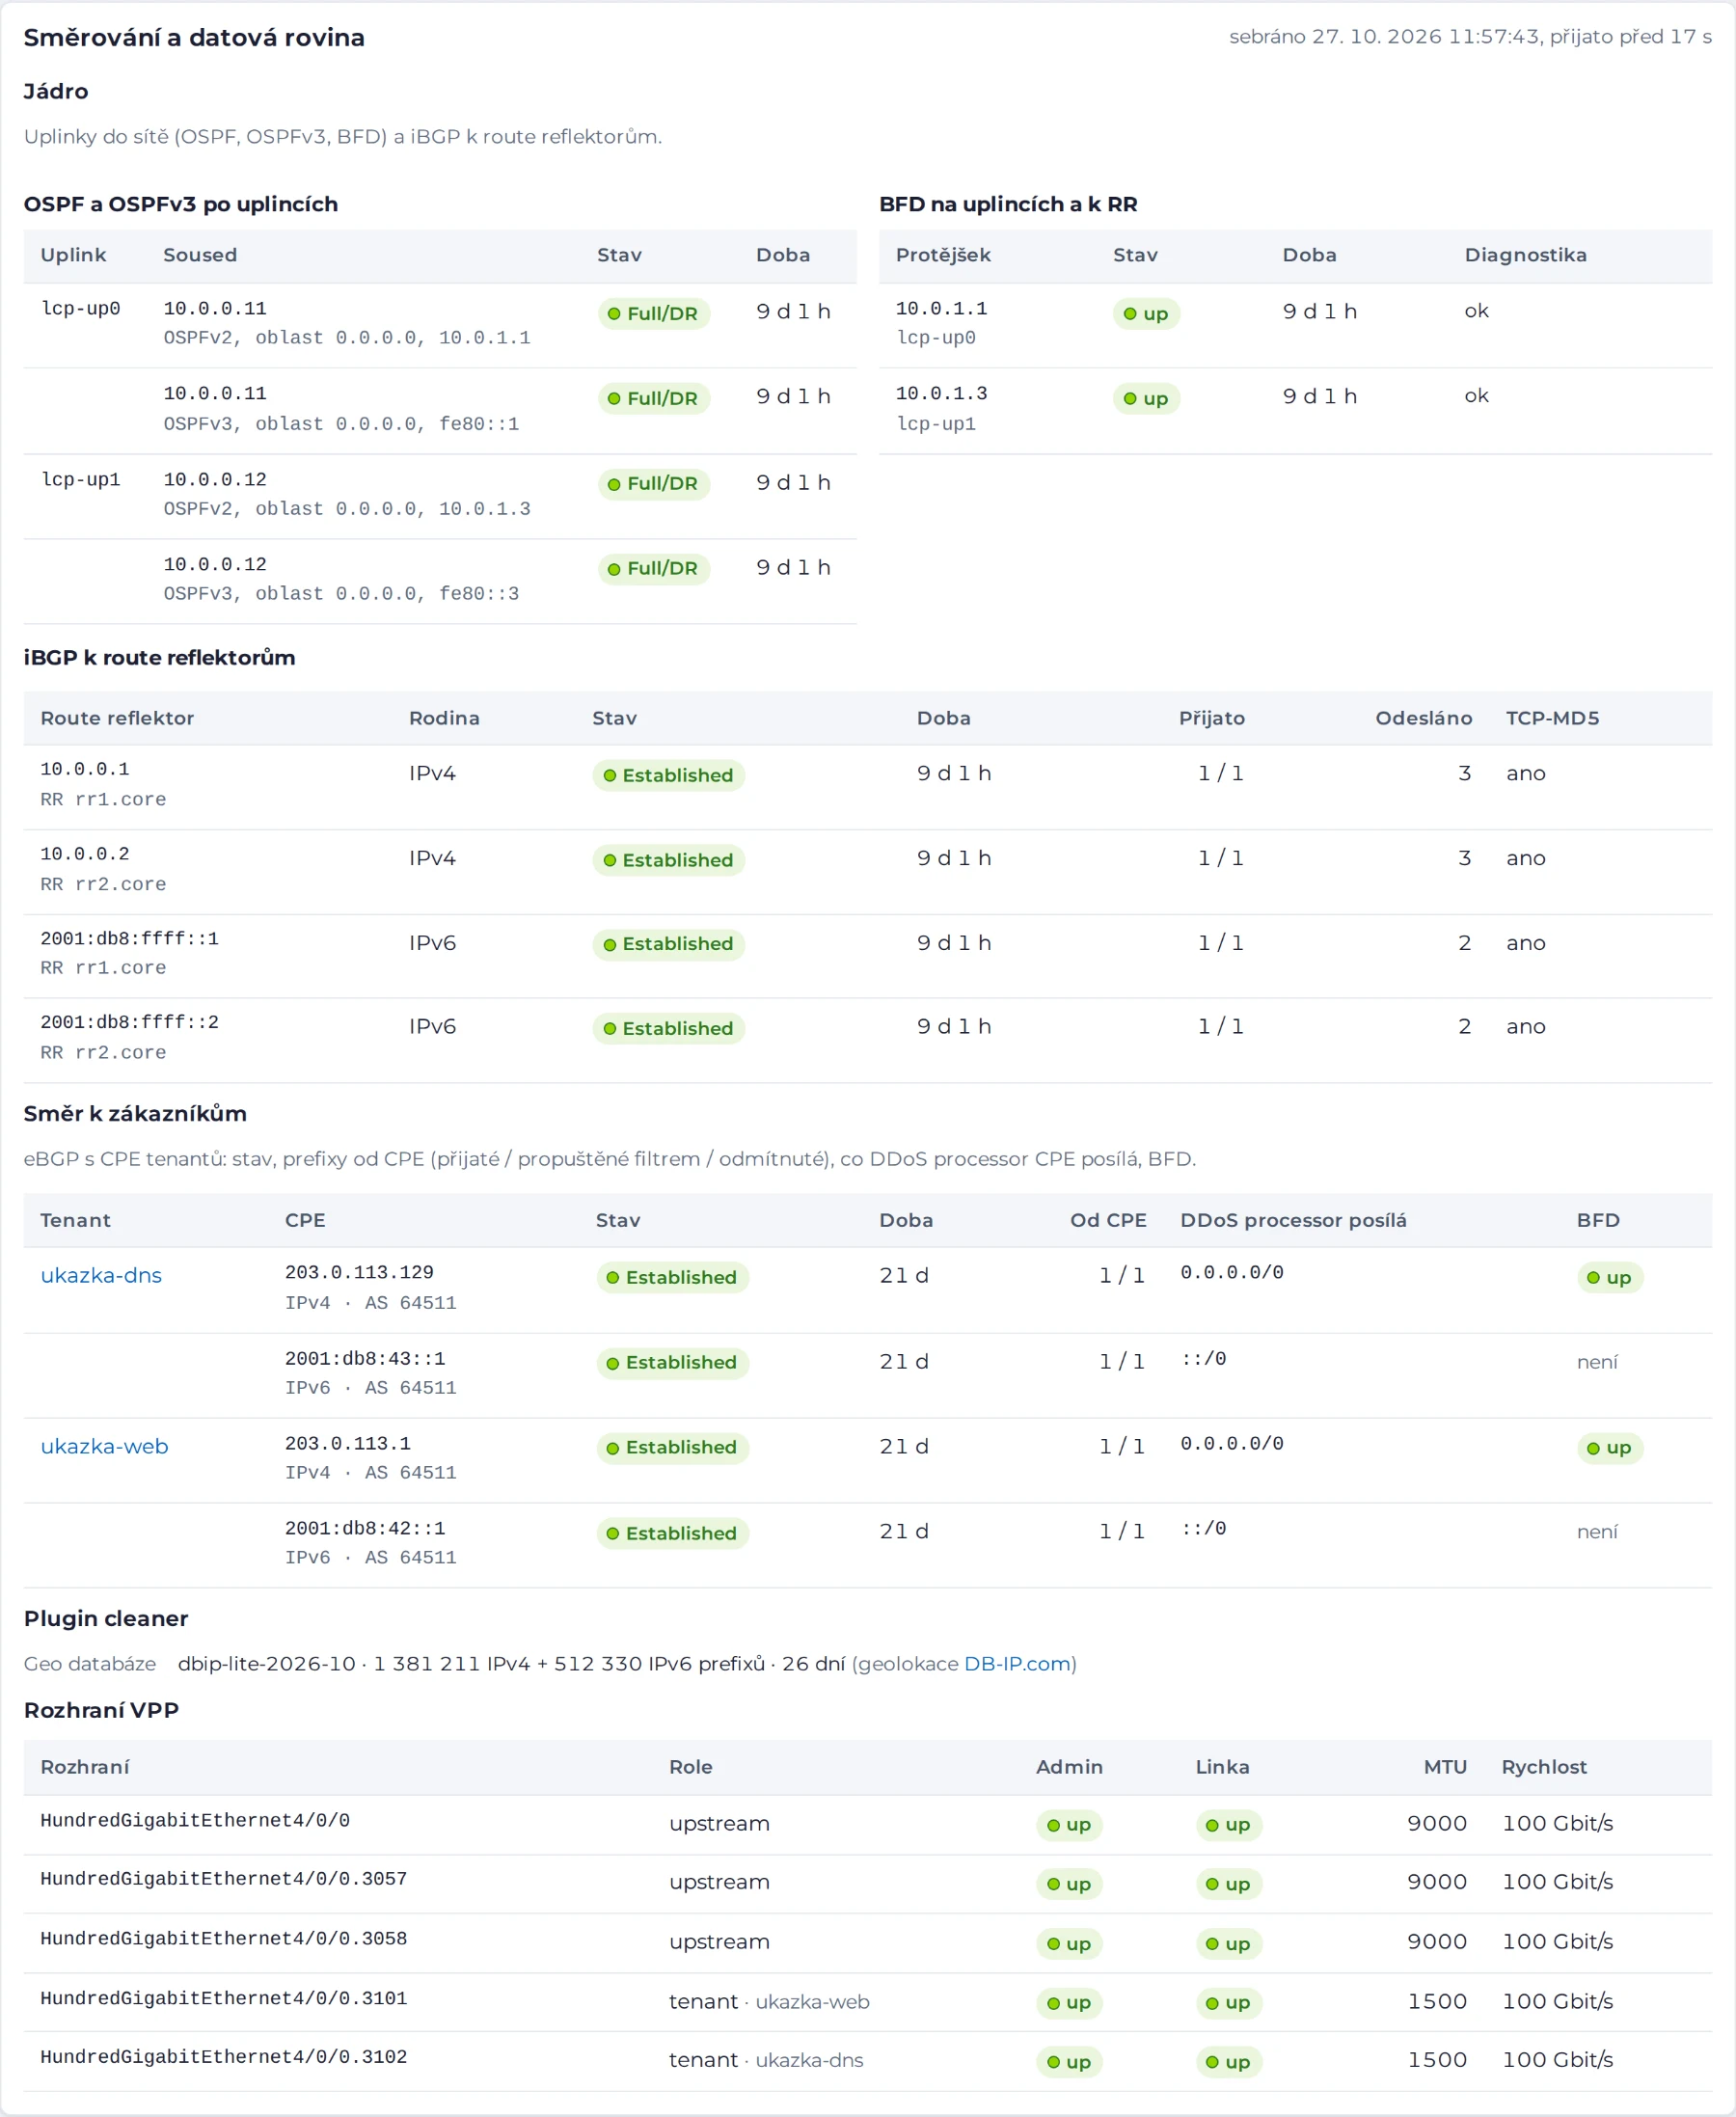
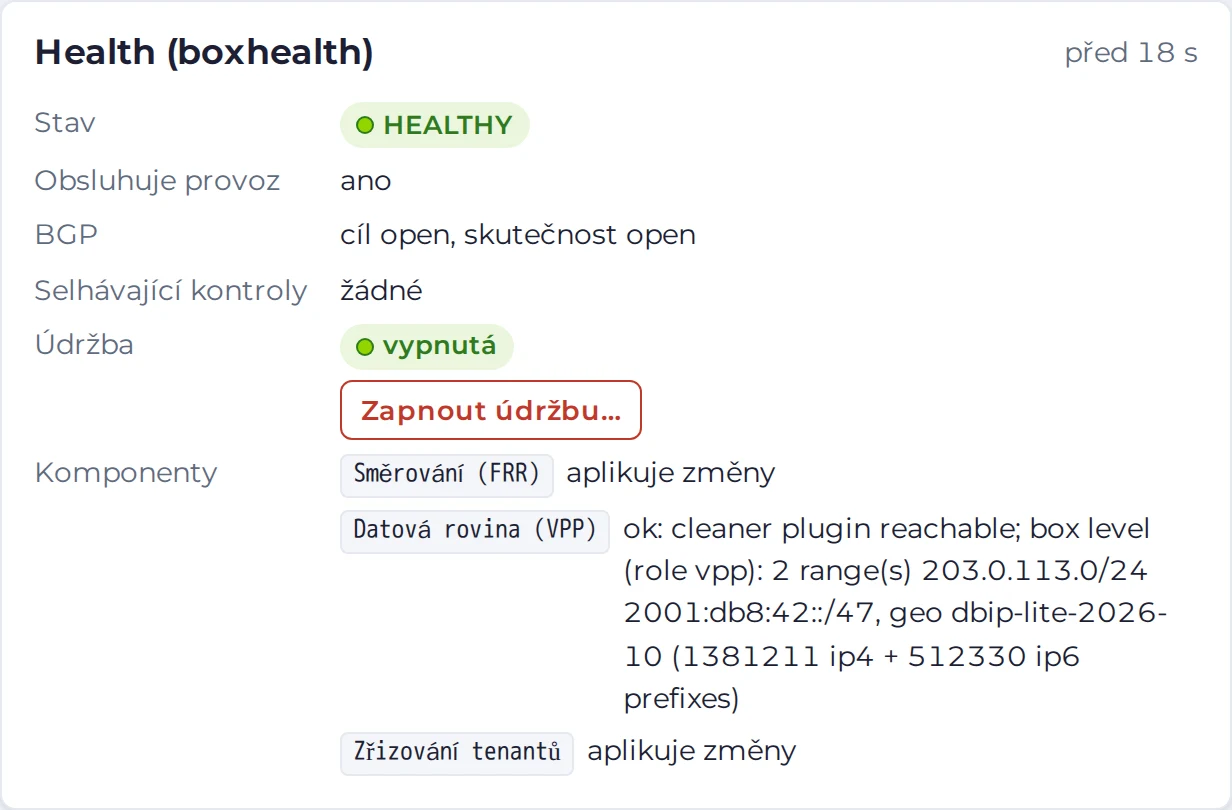
We protect you, we do not read your data
No decryption. The DDoS processor does not hold your keys, does not terminate connections and does not read encrypted content. Of the application layer, it currently sees only DNS queries. We do not record packets.
Summaries only. Counters, attack events and top lists leave the DDoS processor. The top lists contain IP addresses and DNS names. They are created only during an attack or when DNS rules step in, and are kept for 90 days.
Customer separation. Each tenant has its own VLAN, BGP session and policy. In the portal you see only your own tenants; other customers' tenants do not even exist in the server's responses.
Two-factor sign-in. A password and a code sent by e-mail for every sign-in. Accounts are created by an operator through an invitation; you set your password yourself and nobody else knows it.
Roles. An administrator changes the policy and alerts, a reader can only view. One account for multiple tenants, each with its own access level.
A trail for every change. Every policy change is a version with its author, a note and a diff. The DDoS processor communicates with the control server only over an encrypted connection with mutual certificate authentication.
From agreement to active protection
- AgreementPrefixes (IPv4 and IPv6), contracted capacity, VLAN and BGP sessions with your CPE.
- TemplateWe choose a template to suit your services and set up the administrator networks.
- MonitoringFor about two weeks, the rules only count. In the portal you see what they would drop.
- ProtectionOnce you have checked, you switch on enforcement with the Protect switch, or rule by rule.
- OperationAlerts during an attack, an attack report and a monthly report. We fine-tune the limits to your traffic.
Straight talk: what the protection can do and what is coming
Where the limits are
- Against massive volumetric attacks that would swamp the network before they even reach the DDoS processor, a scrubbing centre is automatically brought in upstream. It filters out the attack before it reaches our backbone.
- We do not read encrypted traffic (HTTPS, DNS over TLS and HTTPS). We do not yet inspect the content of web requests.
- Pulses shorter than 5 s are not recorded as an attack. Dropping, however, starts from the first packet, according to the rules.
- DNS checks currently apply to queries over UDP.
What we are working on
Planned
- TLS: recognition by SNI and client fingerprint (JA4), without decryption
- DNS over TCP
Questions that usually come up
Do you have a question for us? Call 227 023 023
It stops announcing your prefixes and traffic goes directly via PE to your backup session. No scrubbing, but no outage. It returns to the path once it is healthy (30 s of stable operation). We carry out maintenance in a controlled way: traffic first moves to the backup path, and only then do we work on the DDoS processor.
The data plane runs on VPP with a custom plugin and processes packets in batches across the processor cores. In lab tests, the DNS server answered during an attack with a p99 of around 3 ms and new connections through the SYN proxy were established with a p99 under 1.5 ms.
The Monitor only switch puts your rules into monitor mode. Basic packet checks and the contracted capacity always apply. Full disconnection from the DDoS processor is done by an operator on request.
Within a few seconds of saving in the portal; the deployment itself on the DDoS processor took tenths of a second in the lab. The server rejects an invalid policy during validation and the DDoS processor stays on the previous version.
That is why every new rule monitors first and the portal shows what it would drop. If it happens anyway, you can switch the rule to monitor mode or go back to the previous policy version with one click. Our operations team can also help.
Yes. Detection, counters and all rules work for IPv4 and IPv6; IPv6 has its own BGP session with your CPE.
In the portal, only accounts that have access to your tenant. Our operations team sees the telemetry of all tenants. We do not store traffic content or packet records.
The screenshots use sample data: a fictitious customer and documentation IP addresses (RFC 5737, RFC 3849). Values marked “lab” were measured in tests on a lab DDoS processor; they verify functionality, not capacity. Geolocation: DB-IP.com.
We will show you on your own traffic.
We first connect the protection in monitor-only mode: in the portal you will see your traffic, attacks and what the rules would drop, before they drop anything.


